Some of the engineers who book a session with us are not evaluating Kubeadapt. They take screenshots, ask sharp questions about how a number is computed, and go back to build their own version.
In 2026 that is an understandable plan. In McKinsey's State of AI survey, published in August with 1,719 respondents, 32% said their organization had decided against buying at least one software product or feature because it could be built internally with agentic coding tools. Those tools are good at getting a first version on the screen.
This post is about what comes after that first version. It is what ours cost once it worked, so you can price yours before you start. Most of the examples are things we got wrong.
The short version
A first version (collect usage, multiply by price, group by namespace) comes together quickly now. Ours looked the same in February 2025.
The expensive part is what follows. A wrong cost figure does not crash; it goes into a budget meeting. A wrong rightsizing recommendation can raise the bill it promised to lower. Code in the kernel can pass every test and still break the node's networking.
For a small setup (one cloud, one network plugin, nobody charged back) building can still be the right call. For most teams the upkeep is the real price, and most of this post is about that.
The first version is cheap now
METR measures the length of software task an AI agent completes half the time. In early 2025 that was about one hour; for the public frontier models of early 2026 it was about 12 hours. The same report gives a figure that gets quoted less: at 80% reliability, the horizon was about an hour and a half.
The best-documented cases near us are observability platforms. Shopify built its own for about 500 Kubernetes clusters, and the engineer who led the work says in the write-up: "If I were to go back and ask, 'Do I really need to do this myself?' the answer is probably not." Coinbase built an in-house stack after owing Datadog $65 million for 2021, and then stayed with Datadog on a new contract.
Our own first version looked like most first versions: Prometheus and OpenCost installed next to a small agent. It worked. If you already run Prometheus and kube-state-metrics, you have most of the raw inputs, and that stack is a sound place to start.
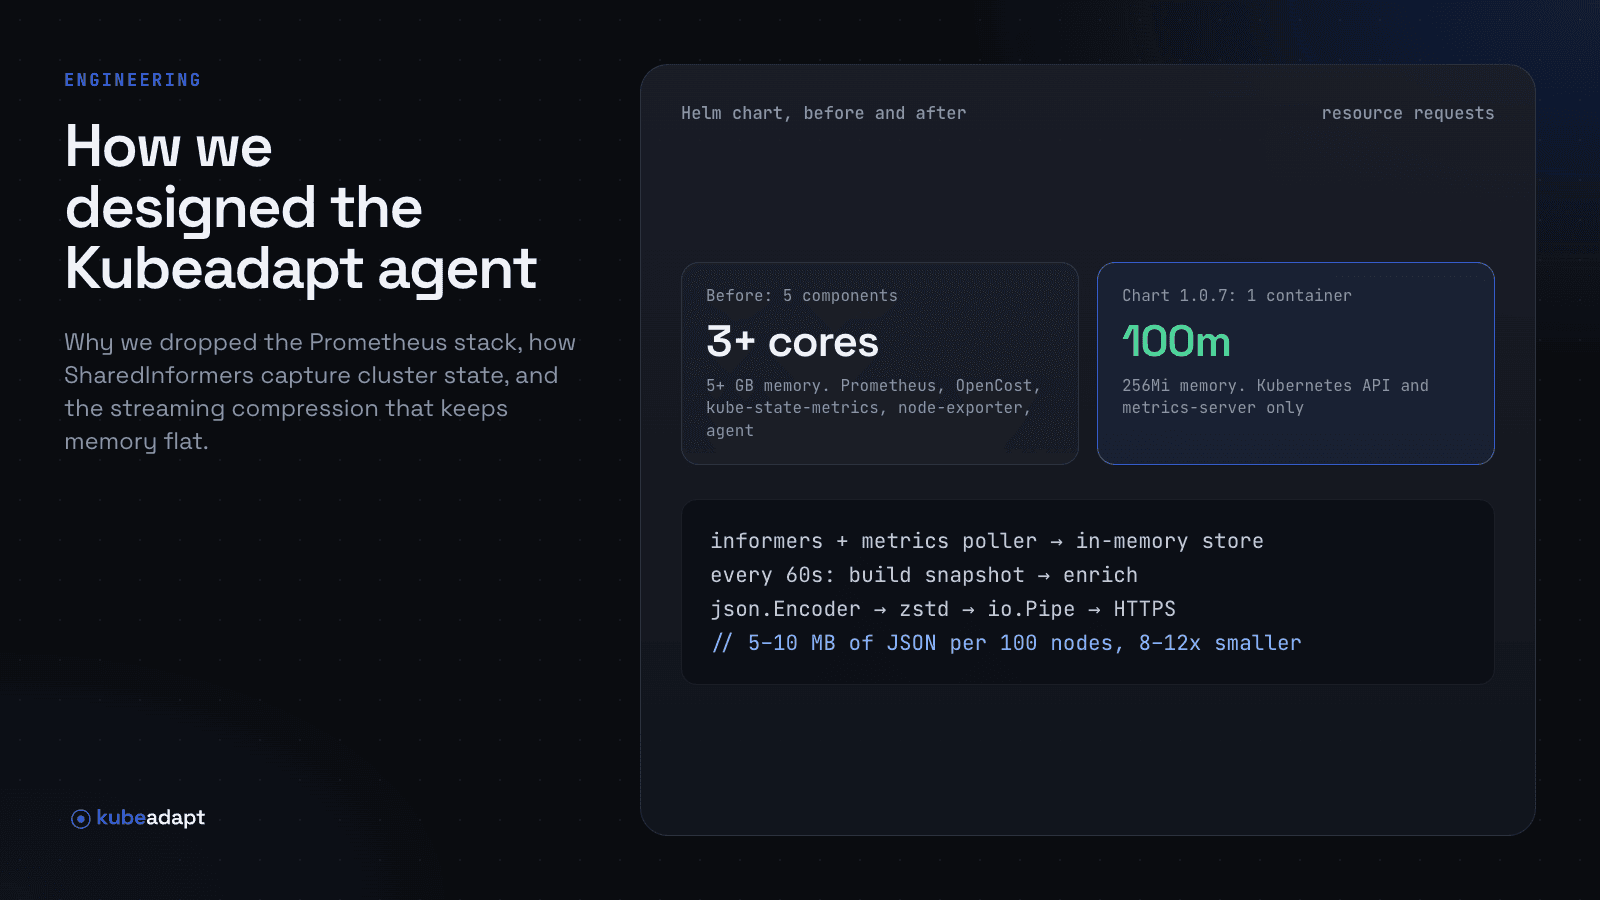
Within a year that install had grown to four bundled components and a configuration file more than a thousand lines long. We replaced all of it with one agent that reads the Kubernetes API directly. I wrote about that design in How We Designed the Kubeadapt Agent. Part of that post turned out to be wrong, and I will come back to it.
This is roughly how each part grew between the first version and now:
| Part | First version | What it needed later |
|---|---|---|
| Collection | Prometheus, kube-state-metrics, OpenCost | One agent on the Kubernetes API that still works on a cluster with 150,000 pods |
| Prices | A list for the instance types you run | Three clouds and 122 regions; list prices synced daily, spot prices tracked around the clock for every provider |
| Allocation | Usage times price, by namespace | Request versus usage, idle, overhead, Jobs, volumes, two views of shared cost |
| Network | Nothing, or VPC flow logs | An eBPF program on every pod's interface |
| Rightsizing | A percentile of usage | Guards for OOM kills, HPAs, and workloads with too little history |
| Alerts | A threshold | A normal range per scope, by hour of day |
| Sharing | A Grafana dashboard | PDF reports, a FOCUS 1.4 export, SSO, access per cluster |
The left column is what got cheap. It is also the smaller part of the work.
What a wrong number costs
A broken service pages someone. A wrong cost figure does nothing of the kind. It is read by a finance partner, copied into a spreadsheet, and used to set next quarter's budget. So the test for a cost tool is whether the person reading the number can act on it without asking an engineer what it means.
Take the plainest question there is: are we on budget? For example, a team has $10,000 for the month. It spends $300 a day for nine days, ships something on the 10th, and spends $700 a day after that. On day 12 it has spent $4,800.
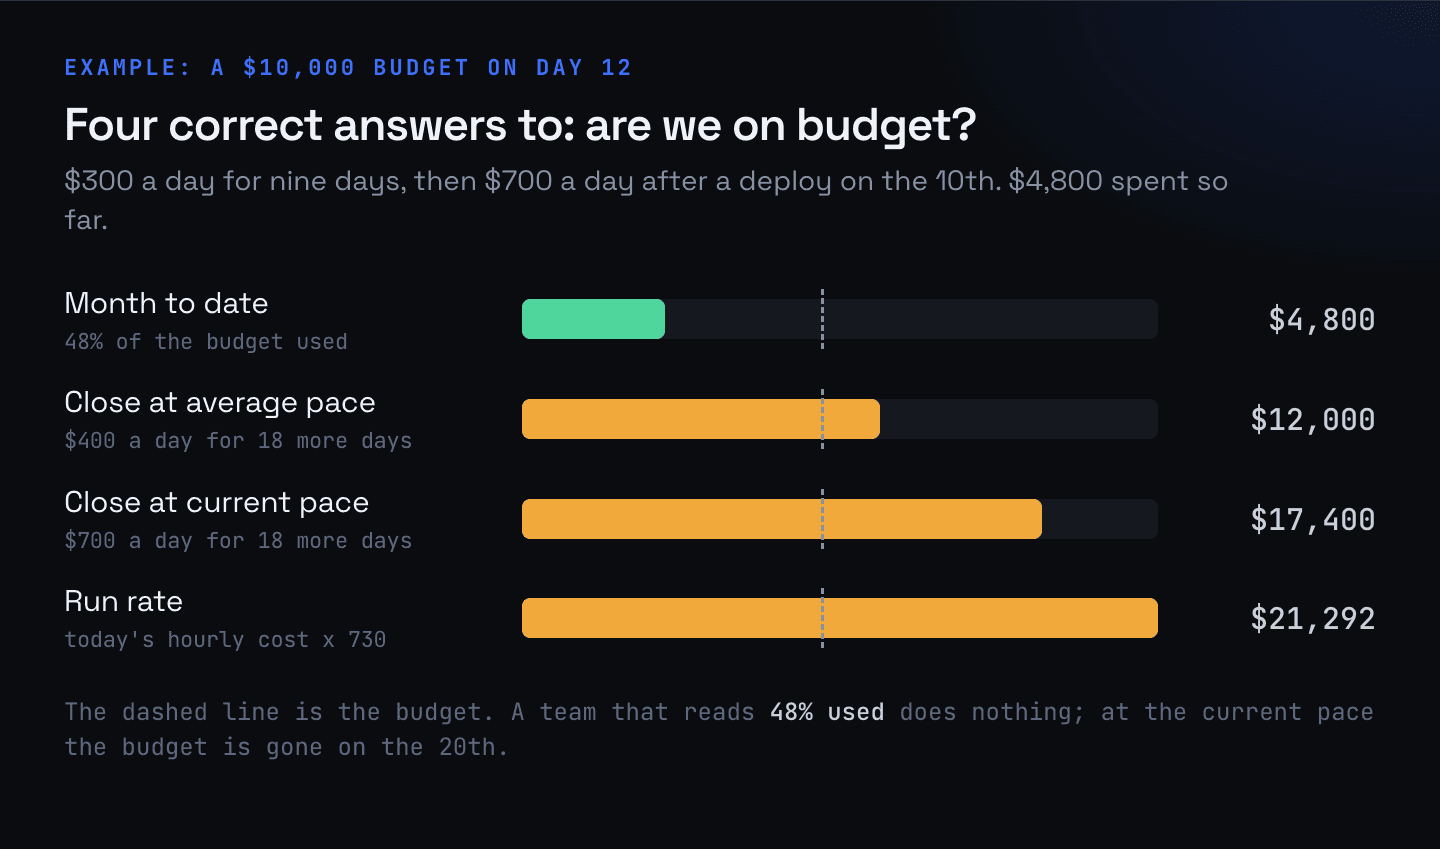 Example: four ways to answer "are we on budget?" from the same $4,800 of spend on day 12 of a 30-day month.
All four numbers are computed correctly. Month to date says 48% used, and a team that reads it does nothing. At the pace of the last three days the budget is gone on the 20th. A tool has to decide which of these it shows next to the word "budget", say so on the screen, and use the same one in the alert. In Kubeadapt a budget alert compares actual cumulative spend with the budget, and the incident it opens carries the projection and the day the pace changed.
"What did team X cost in October?" has the same problem. For example, a $10,000 cluster bill is $6,000 of workload compute, $2,000 of idle capacity and $2,000 of overhead, and team X owns half the compute. Counting only what its workloads reserved, the team cost $3,000. With its share of idle and overhead, $5,000. Both are defensible, and the difference is 67%. Charge back on the first and 40% of the bill belongs to nobody. Charge back on the second and you bill a team for capacity it never asked for. We show both, as Workload Only and Fully Loaded, and keep idle as its own named line.
What we got wrong ourselves
"Usage times price, grouped by namespace" was our first version too. What took us months was getting two screens to agree with each other.
Take the run rate, the "this will cost about $X a month" figure. We have had three definitions of it. The first was the latest hourly cost times 730. We replaced it with the average of the last seven complete days after one test cluster showed $1,528 a month on its own page and $1,941 on the organization dashboard. The trailing week then understated anything young: a pod that had existed for five days showed five sevenths of its cost. So we divided by the days a workload had been alive, using a creation timestamp that, it turned out, moved forward on every rollout. A workload redeployed an hour before the window closed was projected at 168 times its real rate, because a week has 168 hours.
Today we are back to the current hourly cost times 730, and the figure comes with a state: current, not reporting, not priced, ended, or between runs. The API will not return the number without the state, so a missing row can no longer render as $0. Dividing needed the same care.
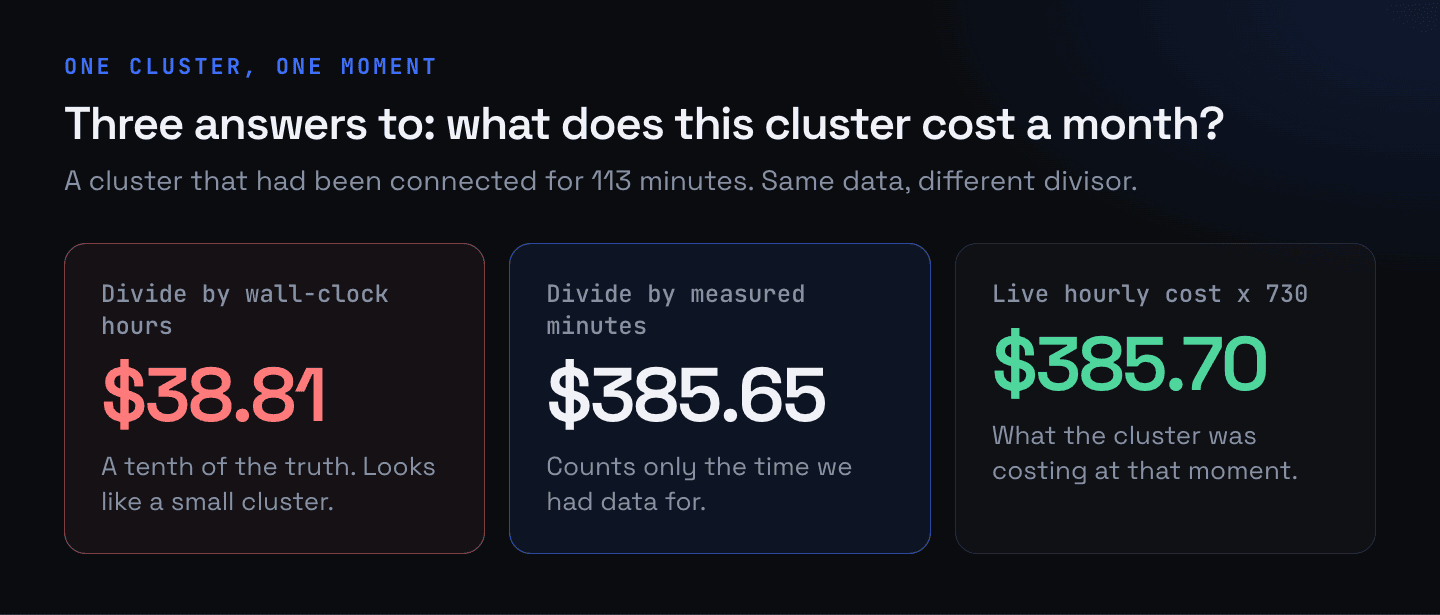 One cluster, connected 113 minutes earlier, and its monthly run rate computed three ways.
Batch jobs were worse, because both figures were right. We split each node's cost across its long-running containers, and separately priced each Job run. The capacity a Job used had already been handed out to the other workloads as idle. Sum the workloads and you exceed the cluster total by exactly the cost of the Jobs: $1.0024 over a week on one of our test clusters. We found it because we compare the sum of workloads with the cluster total to four decimal places. A dashboard that only shows the top ten namespaces would never have shown it.
The calendar caught us too. new Date(2026, 3, 1) in a browser at UTC+3 is 21:00 UTC on March 31. Our backend floored that to a date, so "April" included the last day of March for every user east of Greenwich. The cost engine now refuses any date that carries a time zone.
Prices that change every five minutes
A price list looks like the easy part. It is a small distributed system of its own.
AWS sets a spot price per instance type, per operating system, per Availability Zone, and keeps 90 days of history for each. If most of your cluster runs on spot, a tool with hard-coded on-demand prices is wrong by a large factor, and a tool that assumes a flat spot discount is wrong by a smaller one in a way nobody will notice.
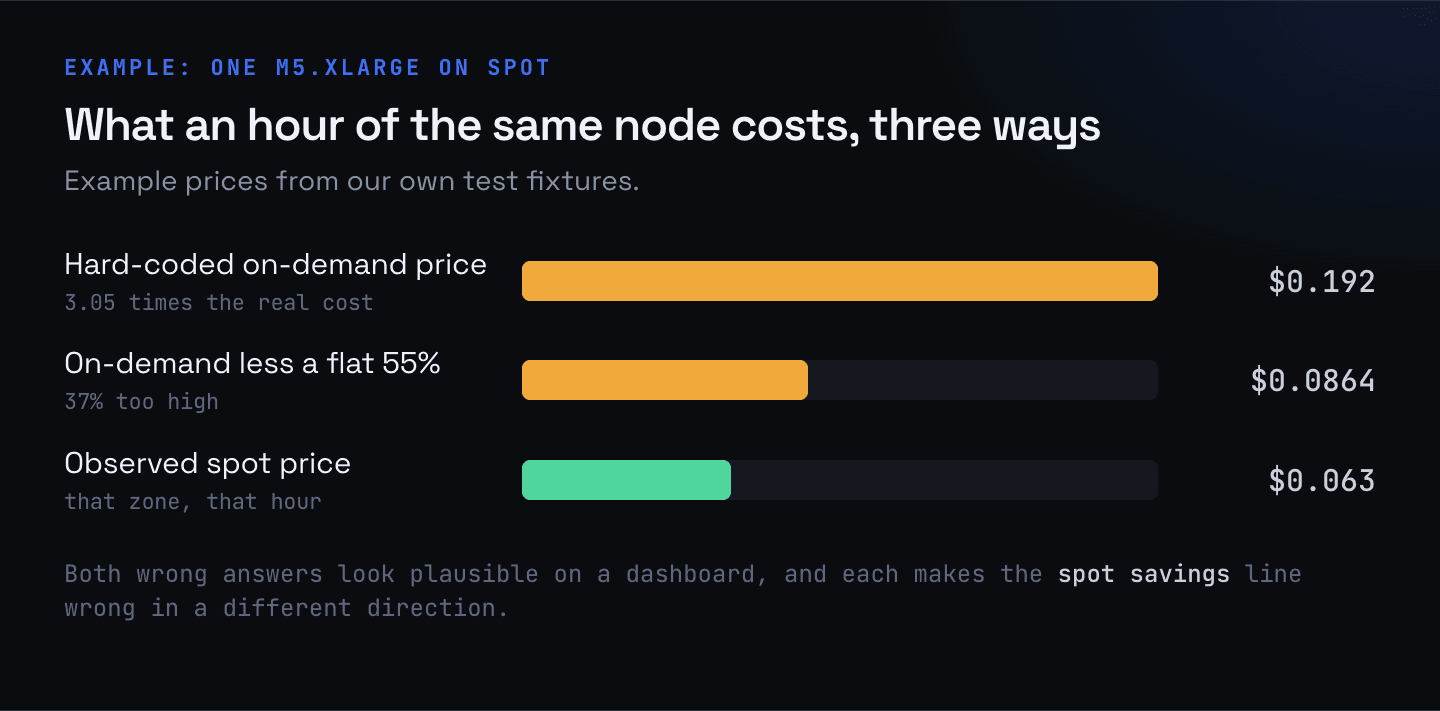 Example prices from our test fixtures: an hour of one m5.xlarge on spot, priced three ways.
Our price catalog syncs list, storage and network prices daily and tracks spot prices around the clock for every provider, every 5 minutes on AWS, where they move fastest. When a node is priced, the lookup goes through the customer's own rate, a cache keyed by zone and then region, the stored price, and for spot an estimate marked low confidence. If nothing answers, the data is refused and the agent retries, because a guessed price is worse than a late one. Every day a sample of prices from each provider is checked against a second source.
Each of those rules exists because of a mistake:
- Our first AWS spot sync walked 90 days of history per instance type and zone, and could not finish inside its own 5-minute interval. The cache held zero AWS spot prices, so every AWS spot node was priced as on-demand. Asking for the last hour only brought a region from minutes to seconds.
- The 5-minute update wrote an empty value over the spot average. A consumer computed savings as on-demand minus nothing, and "move to spot" showed 100% savings.
- One slow sync for one provider blocked the shared loop, and another provider's spot prices went unwritten for more than two hours.
- Next to every license-included Windows price, AWS lists an infrastructure-only one at the Linux rate. Our importer kept whichever row came last in the file, and about half of the Windows instance types were priced 35% to 78% too low.
- Our first sync of AWS network prices returned no internet egress rows at all, so every egress dollar read $0.00. AWS and Google Cloud bill network traffic per GiB and Azure per GB, a 7.4% difference if you mix them.
None of these raised an error.
The data layer between the cluster and the screen
This is the part nobody screenshots. It is also where most of our maintenance goes, and where a figure can be correct in one table and wrong in the next.
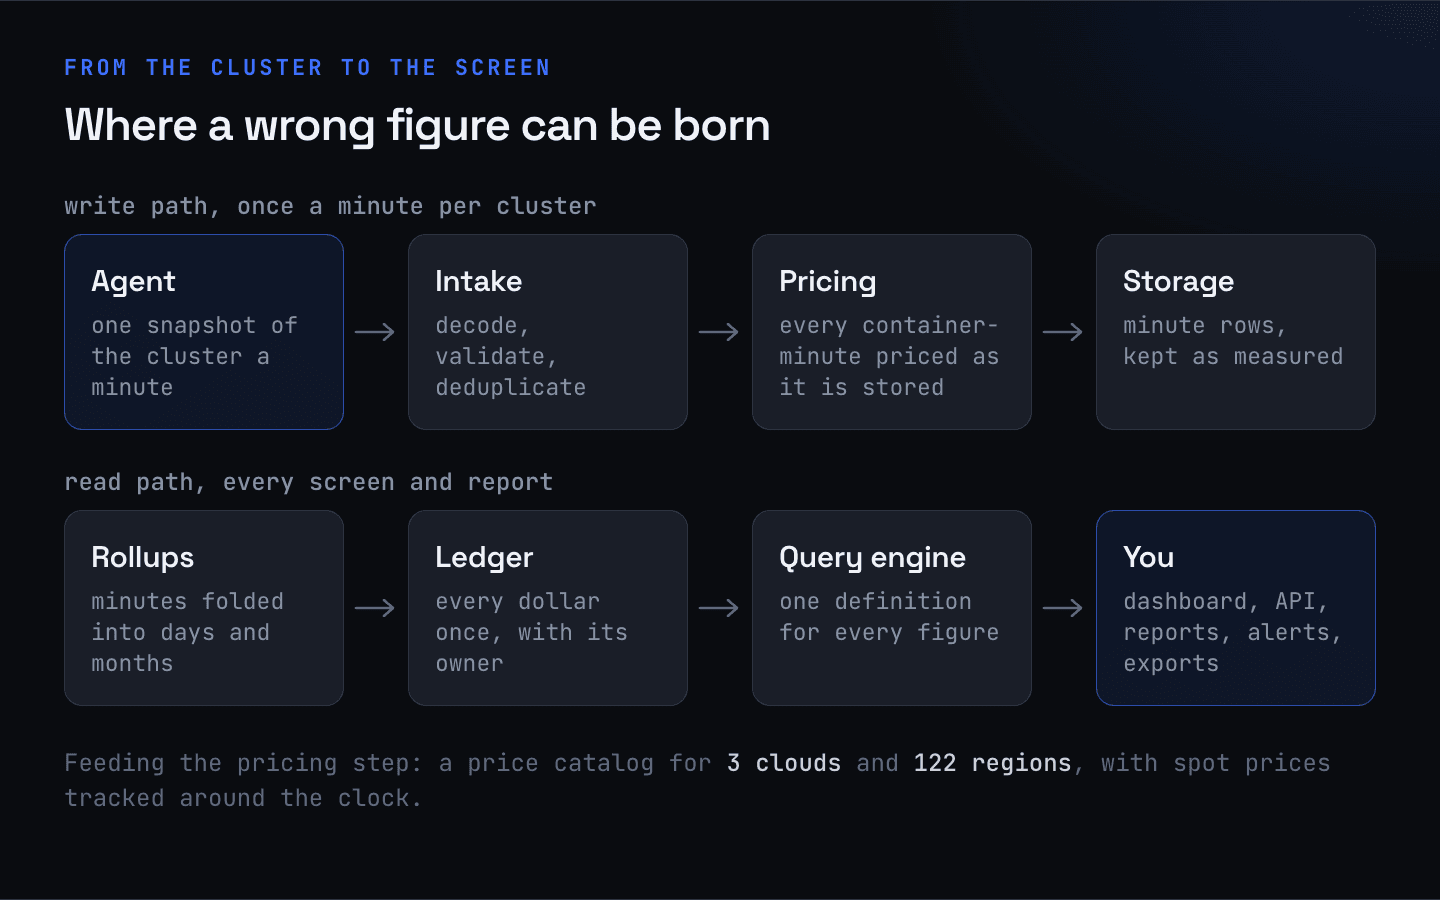 The path of one snapshot from the agent to a figure on a screen.
Every minute, each cluster sends a snapshot. It is priced as it is stored, and a chain of rollups folds the minute rows into days and months, some as the rows arrive and some on a timer. A ledger holds every dollar once, with where it came from and who it was allocated to. Every screen, report, alert and export then reads through one query engine.
The reason for all of it is that SELECT sum(cost) GROUP BY namespace over raw rows stops answering once you have a few months of data and more than one question. The moment you add rollups, you have several copies of the same money, and they have to agree. These are some of the ways ours did not:
| What happened in the pipeline | What a person looking at the screen saw |
|---|---|
| A rollup that is rebuilt on a timer ran just after midnight, when the new day had almost no rows, and replaced the table. It held 0.05% of the cost in the layer below. | Today's cost near zero, and a month-to-date figure that did not move for 40 minutes while data was arriving |
| A column was added to a summing table and to the view that fills it, but not to the table's list of columns to sum. Background compaction then kept one arbitrary row's value. | The namespace report totaling a fraction of the workload report for the same month, with both changing overnight |
| Minute rows carry dollars per hour. One view summed them without dividing by 60. | Every figure built on seven downstream tables 60 times too high |
| The deduplication key was the snapshot id. A restart sent two snapshots in the same minute. | That minute billed twice |
| We changed the key to cluster and minute. A real second sample that landed in an occupied minute was dropped. | Some minutes billed at zero |
| Nodes with exactly equal cost were sorted by cost alone. Floating-point sums differ in the last bit between two correct queries. | The same row on page 1 and again on page 2, and an export whose rows did not add up to its header |
We got the deduplication key wrong four ways before settling on assigning each sample a minute slot. The fix for the third row corrected new data only, and history stayed 60 times too high until it was rebuilt.
The optimizations are less dramatic, and they are constant. Two rollup views joined against their whole source table every time a row was inserted, so writing 3 rows took 11,616 ms. Rewritten to aggregate only the inserted block, it takes 211 ms. Nothing was wrong with any figure in the meantime. Snapshots just started missing their deadline, and gaps are their own kind of wrong number.
Two practices are what I would copy. The first is one query engine that every screen calls, with its SQL pinned, so a change to any statement shows up in review as a diff. The second is that before the last screen moved from its own SQL to the engine, we replayed a corpus of real request shapes against both paths. The first run found 69,425 field differences. The last found none that were not declared and explained. Without that replay, a refactor changes last quarter's numbers and nobody can say which version was right.
How the cost model itself works is public in How costs are computed.
What a wrong recommendation costs
Recommendations are where a cost tool stops describing and starts advising, and the downside changes with it. Datadog's 2024 cloud cost report found that "83 percent of container costs are associated with idle resources", so the saving is real. The same company's container report notes that "many teams intentionally overprovision resources to prioritize stability". Both are true, and a recommendation has to respect the second to earn the first.
The simplest rightsizing logic is a percentile of last week's usage. Here is what it does to a workload behind a Horizontal Pod Autoscaler. Kubernetes computes utilization "as a percentage of the equivalent resource request", so halving a request doubles the utilization the autoscaler sees.
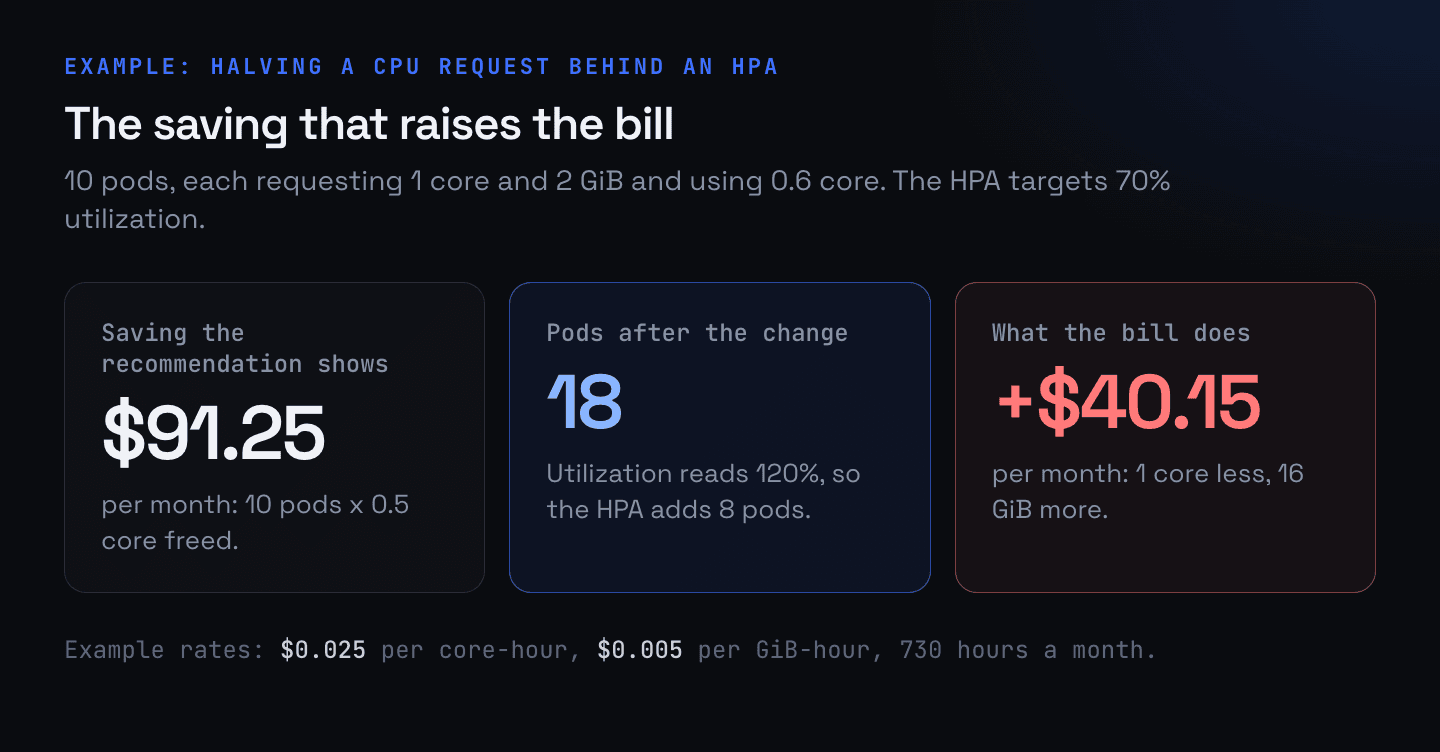 Example: a rightsizing recommendation that ignores the autoscaler. The promised saving is $91.25 a month; the bill rises by $40.15.
The recommendation promised $91.25 a month, or $1,095 a year. The bill went up $482 a year, and someone reported the $1,095 as saved. Kubeadapt will not cut a CPU request below the observed peak divided by the autoscaler's target. In this example that allows 0.86 core instead of 0.5: a saving of $25.92 a month with the replica count unchanged.
Three more, each with the arithmetic:
Freed capacity is not a lower bill. For example, three 12-core nodes at $438 a month each run 30 cores of requests. Rightsizing frees 4 cores, and the tool shows $146 a month saved. 26 cores still need three nodes, so the bill changes by $0. Free 7 cores and the tool shows $255.50, while the bill drops by one whole node, $438. The figure on the recommendation is reached in neither case. Our rightsizing page labels the number "Reclaimable capacity" and says the bill drops once the freed capacity lets a node be removed.
Lowering a memory limit saves nothing. Limits are not billed. For example, cutting a request from 2 GiB to 1.1 GiB saves $3.29 a month per replica whether or not the limit moves. Lower the limit to match and you have added a month-end out-of-memory kill for $0.00. We never lower a memory limit, and after an OOM kill we never cut the request, because the observed peak was capped by the old limit and says nothing about what the process needed.
Two savings can add up to a free workload. For example, a workload costs $1,000 a month. Rightsizing saves $400. Moving it to spot at 60% off saves $600. A dashboard that sums them reports $1,000. Applied in order, the second saving is 60% of $600, and the total is $760. We leave the spot figure out of every total while the rightsizing one is open.
The cost of getting this wrong is lopsided. The saving in the examples above is tens of dollars a month. In New Relic's 2025 survey of 1,700 respondents (a vendor survey, self-reported), the median cost of a high-impact outage was $2 million an hour. A recommendation engine that is right nine times and causes one restart loop will be switched off, and it should be.
Code that runs in the kernel
The cloud bill has one line for data transfer and it does not name a pod. To put network cost on a workload you have to count bytes where the pod's address is still visible, which in practice means an eBPF program on the host side of every pod's network interface. This is the part of the product where I would least trust a first version, and I include ours.
The research on machine-written eBPF is thin. The KEN paper (2023) reached 80% correct programs only by wrapping the model in symbolic execution and verifier feedback, and a July 2026 study found that models repaired a rejected program in one attempt between 0% and 37% of the time. Models are better than both papers now.
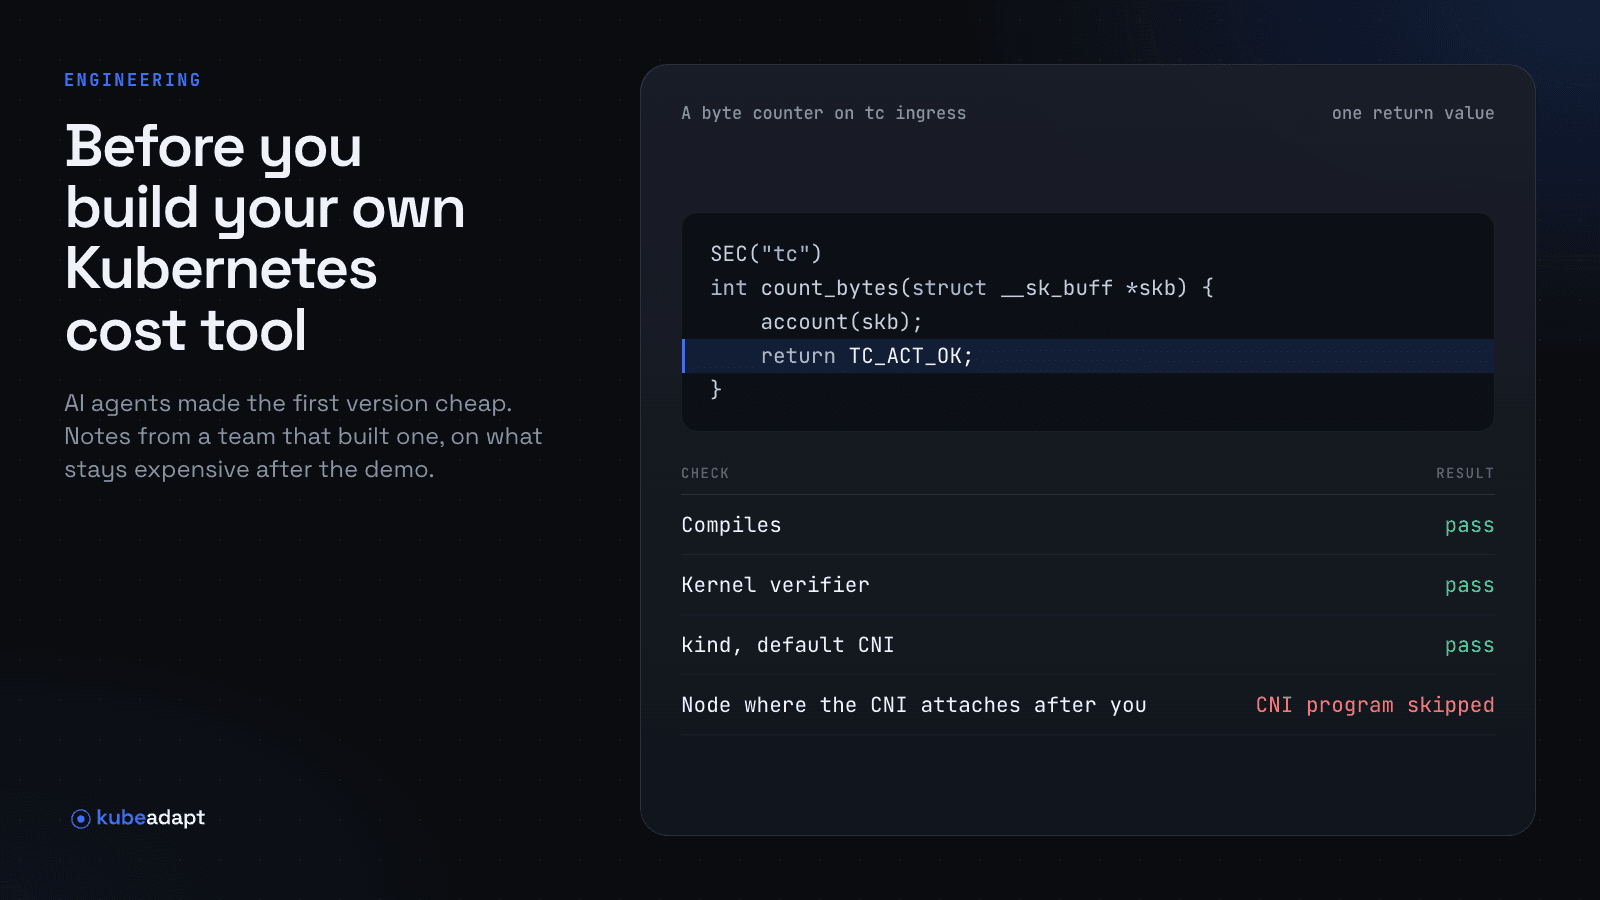
Getting past the verifier is the smaller problem anyway. An agent will iterate until the program loads. The verifier proves the program terminates and stays inside its memory. It has no idea what else runs on the node.
One return value
1SEC("tc")
2int count_bytes(struct __sk_buff *skb)
3{
4    account(skb);
5    return TC_ACT_OK;
6}
TC_ACT_OK reads as "let the packet through", and most tutorials return it. On a tc chain it also means "stop here": programs attached after yours do not run. If your CNI attached its program after yours, that skipped program is the one doing Service load balancing and network policy for the pod. The value you want is TC_ACT_UNSPEC, "no opinion, run the next one".
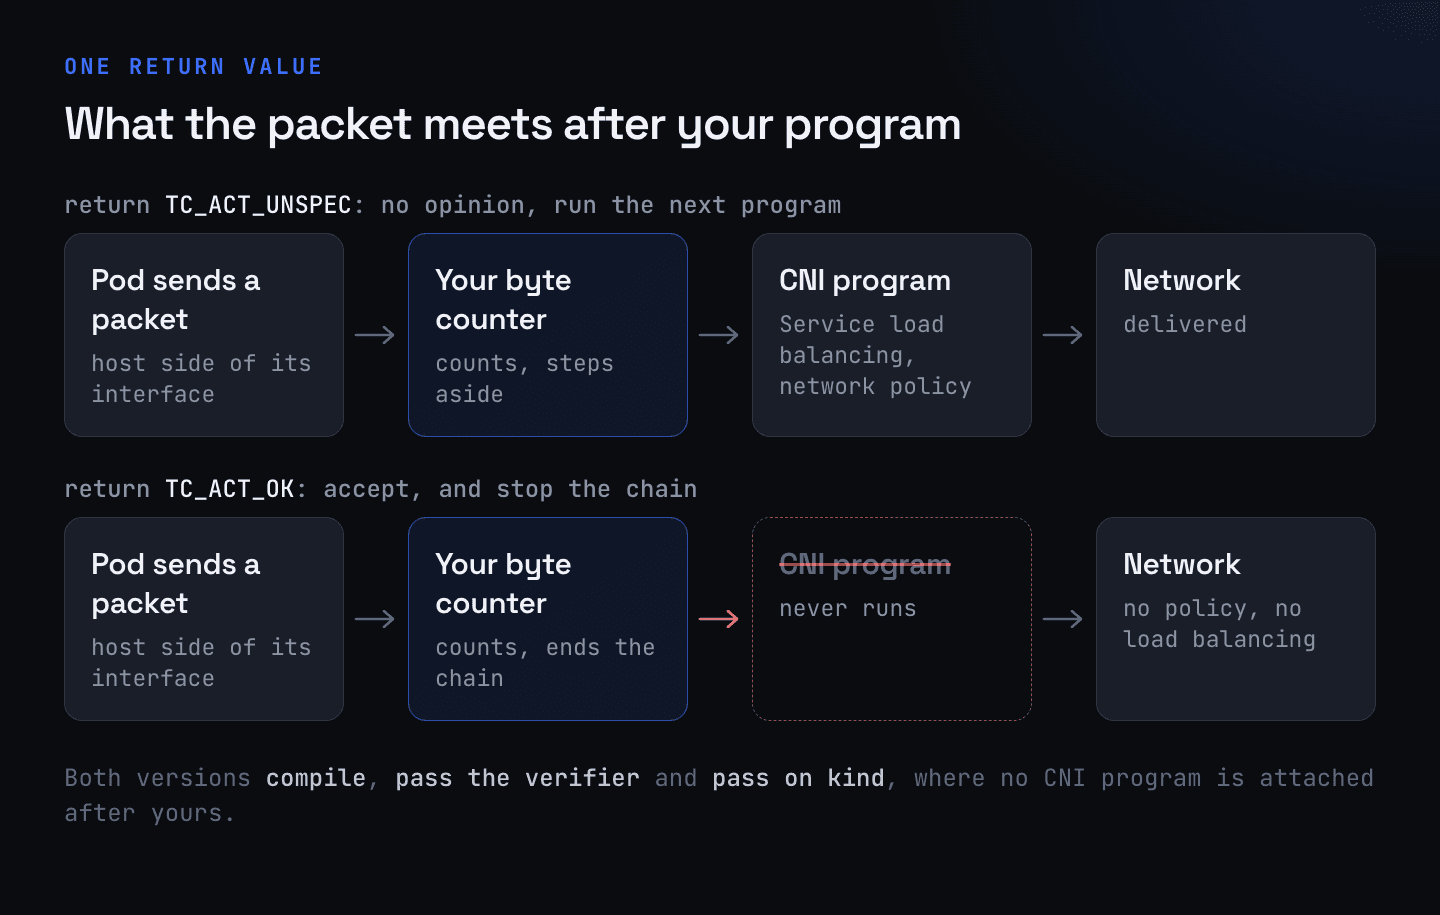 The same byte counter with two return values. Both compile, pass the verifier and pass on a test cluster.
The version above passes on kind, because kindnet attaches no tc program behind you to starve. We have a test that parses the C source and fails the build if either tc program can return anything else. The two cgroup programs we attach have the opposite polarity (1 passes, 0 drops), and they have their own test.
Sharing a hook with the CNI
Datadog published a rare, honest account of this in January 2026. Its security agent sometimes attached tc filters before Cilium did and ended up on the handle Cilium uses. When Cilium replaced them, Datadog's cleanup logic removed Cilium's filters, "breaking pod connectivity". Their fix was a higher priority number, so infrastructure programs run first, and cleanup logic that never deletes a queuing discipline.
That bug lives in the netlink arguments, which no verifier ever sees. It only appears on nodes where a second agent uses the same hook, which is common in production and rare on a test cluster. It shipped from a team with years of kernel experience.
Three wrong filters in one day
On one of our test clusters, 231,501 of 243,789 plaintext HTTP requests in a window of 3 hours 55 minutes were kubelet health probes. Report requests per route without setting them aside and every chart is a chart of health checks.
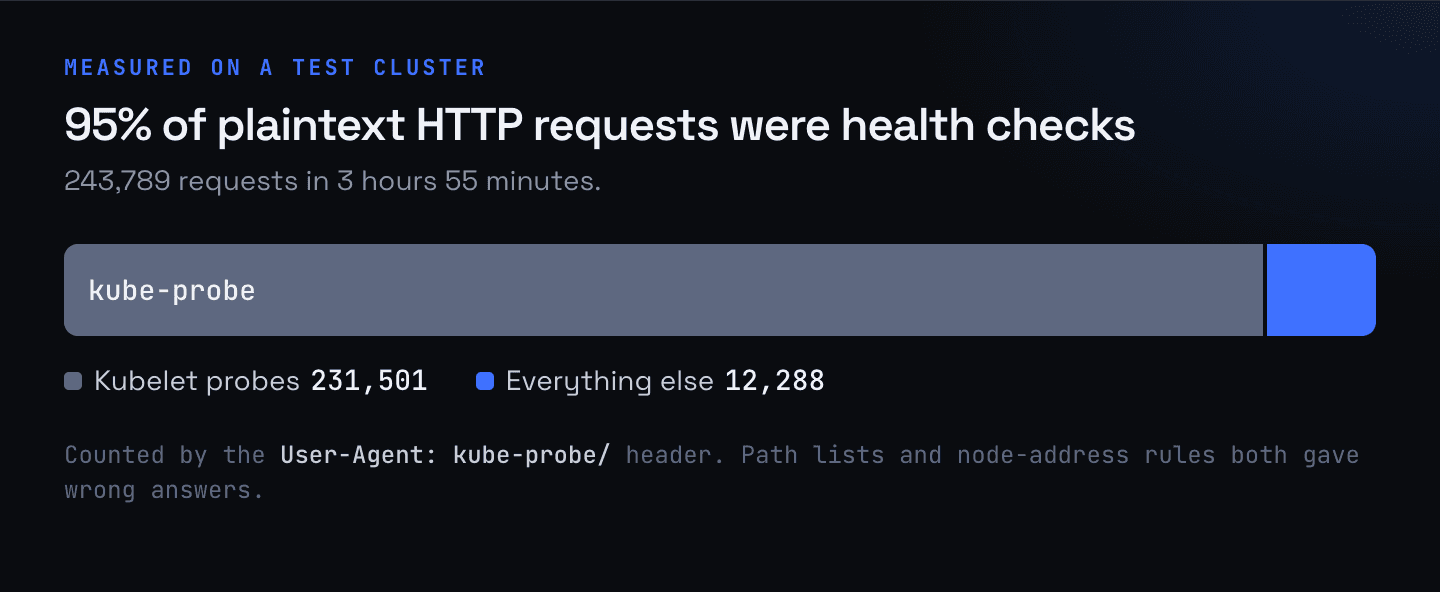 Kubelet health probes as a share of plaintext HTTP requests on a test cluster.
In one day we tried three ways of recognizing them, and each was wrong in a way no test showed.
The first dropped HTTP whose client address was a node, since the kubelet dials from the host. Traffic entering the cluster is source-NATed to a node address too, so we were discarding real requests: one of our own services logged 32 API calls in 20 minutes and we recorded none. The second matched the User-Agent: kube-probe/ header inside the eBPF program. The verifier rejected it and the DaemonSet crashlooped on the first node it reached. The third matched the header in userspace and caught only 17% to 38% of probes, because our capture sizes stepped from 128 bytes straight to 64 and a minimal probe is about 127 bytes, so the header was cut in half. When we added intermediate sizes, every agent pod was OOM-killed 70 seconds later. We blamed the new sizes and reverted them. They were not the cause.
Memory the Go runtime cannot see
A heap profile found the cause: a single 86 MB string, 73.5% of the live heap. We had asked the kernel for the verifier's log at its most detailed level, the eBPF library keeps that log attached to the program object for the life of the process, and nothing ever read it.
The second cause was our own arithmetic. The kernel charges eBPF maps to your container's memory limit, and the Go runtime cannot see them. We set the Go memory limit to 90% of what remained after the maps: (384 - 98) x 0.9 = 257 MiB, which left 29 MiB of headroom, and every map we added shrank it further.
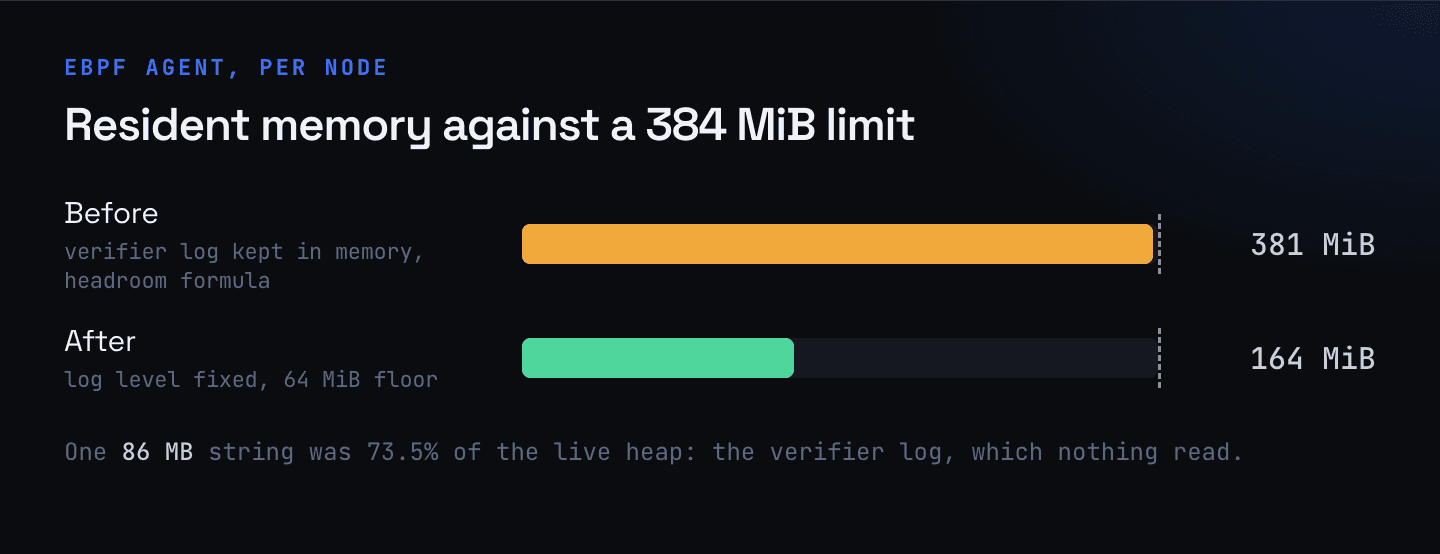 Resident memory of our eBPF agent per node, before and after both fixes.
An idle test cluster shows neither problem. The log grows with the complexity of the program, and preallocated maps cost their full size from the first packet.
A 32-byte struct and a kernel that writes at offset 56
To check that attaching to a cgroup would not silence someone else's program, we call bpf(2) directly with BPF_PROG_QUERY. The first version declared a struct with only the fields we read, 32 bytes long. That is ordinary Go. As a syscall argument it is a memory-safety bug: the kernel writes its answer at fixed offsets whatever size you pass, and recent kernels write a revision field at offset 56. On a recent kernel that write landed 24 bytes past our struct, on the Go stack, and the agent died on every start with a nil-pointer panic in an unrelated frame. On a developer's machine it passed. We caught it on a test cluster the same day.
Wrong numbers with no error
These worry me more than the crashes. With Cilium's BPF host routing, a packet is handed straight into the destination pod and never crosses the hook where we first counted received bytes. That hook ran for about 0.2% of packets. Of 5,101,802 HTTP requests between nodes we captured none, while same-node capture was complete. Over 24 hours the hook saw 12% of the received bytes the kubelet reported, and between 0.04% and 102% depending on the workload. No multiplier corrects that. We now count received bytes with a second program at socket delivery, which measured 99.5% of what the kubelet reported. HTTP between nodes is still not captured on those clusters, and each affected flow says so.
The feature we decided not to build
Reading HTTP inside TLS means uprobes on the application's TLS library: the agent patches a breakpoint into the customer's process. We evaluated it in August 2026 and did not build it. Attaching a uprobe writes into the process's code page, which forces a private copy of that page for each process, charged to the customer's container. Our line is the application's own memory, so Kubeadapt shows HTTP routes for plaintext traffic and names TLS destinations from DNS.
The public record since then supports the caution, and the teams in it are careful ones. In kernel 6.11 the return half of a uprobe became a system call. Docker's default seccomp profile did not allow it, and in the words of the kernel commit that fixed it, "when attaching uretprobes to processes running inside docker, the attached process is segfaulted when encountering the retprobe." The process that died was the customer's application. Datadog's pull request for its agent says it plainly: without the fix, its service monitoring "can trigger segmentation faults in customer applications, leading to unexpected crashes." Their fix detects the affected kernels and turns the feature off there. Nothing in the agent's code had changed. A kernel release did it.
At FOSDEM 2026 a Datadog engineer described a second case, "service unavailability on a few nodes in production" from lock contention between uprobe registration and firing. Pixie has had an issue open since July 2023 titled "Go uprobe attachment causes application segfault in certain scenarios". And a uprobe regression in two stable kernel series let a sampling profiler panic whole nodes; one reporter wrote "I have kernel panic almost every day", and a kernel maintainer noted those versions were running on some EKS and GKE nodes.
These are the best-resourced eBPF teams in the industry, and the failures came from kernels, runtimes and container defaults changing under code that had been correct. An in-house agent has the same exposure and a smaller team watching for it.
Several of the first versions above were exactly what you get when the bar is "loads and passes the test", whoever writes the code. What caught them was a second, independent counter on a real node: the kernel's link statistics, a packet capture, the kubelet's own numbers.
What it costs to keep it working
The first version is a project. Everything after it is upkeep, and the schedule for that upkeep is set by other people's releases.
The kernel moves under you. The DepSurf study (EuroSys 2025) checked 53 real-world eBPF programs against 25 kernel images spanning eight years and found 83% affected by dependency mismatches. Your nodes get a new kernel whenever your cloud's node image does, and you learn which of your hooks changed meaning when a number goes quiet. The uprobe failures in the last section were all of this kind: nobody touched the agent, and a kernel release changed what it did.
Kubernetes moves. We support versions 1.24 to 1.35, and in that range the meaning of a correct cost row changed more than once. Native sidecars arrived: an init container that keeps its reservation for the pod's whole life, where every earlier init container released it. The setting that keeps Service traffic in its own zone was renamed between releases, from PreferClose to PreferSameZone. Each node provisioner marks spot capacity and node groups with its own labels, and a new one means nodes that are silently priced as something they are not.
The clouds move. Price lists change shape without notice. AWS added a $0 entry for reserved capacity blocks next to the real price, and our catalog dropped the largest GPU instance types until we caught it. Azure's query for VM prices also returns rows for a different service under the same name at a different price. Azure stopped charging for traffic between availability zones in 2024 and still publishes the meter. New instance families and regions keep arriving, and a tool with a hand-kept price list falls back to a default for them without telling anyone.
Your own agents age. Whatever runs in the cluster is upgraded on the cluster owner's schedule, so the server has to keep understanding every version still out there. For us that means a new field is declared on the server before any agent sends it, and an unknown field from a newer agent is logged and tolerated. In-house you control both ends, which helps until the cluster with the old agent is the one nobody dares to touch.
History has to survive all of this. When you fix how a figure is computed, last quarter's report still has to mean something. The fix for the missing division by 60 corrected new rows only, and the old ones stayed wrong until we rebuilt them. When we changed how shared cost is allocated, every window that crosses the change had to say so on the screen. A report that was sent to finance has to keep the figures it was sent with.
And some of your own decisions turn out wrong. An earlier post of ours said the agent's streaming encoder keeps memory flat. At 150,000 pods one snapshot is 527 MiB of JSON, and the encoder was holding all of it: the heap peaked at 2,495 MiB. The same post said that when the Kubernetes API is slow to sync, the agent sends what it has. A partial list is dangerous, because the server reads a missing workload as a deleted one. We found both by auditing our own agent, months after we had described them as working.
None of this is exotic work. It is steady, it never ends, and it needs someone who still remembers why each rule exists. The public record of in-house cost tools suggests that person is hard to keep. kube-resource-report, the Kubernetes cost report a Zalando engineer open-sourced, is archived, with its last push in October 2020. Ice, the AWS usage tool Netflix open-sourced in 2013, had its last push in October 2022. Netflix wrote in December 2024 that "maintaining data completeness while ensuring correctness becomes challenging", and that is a company with a dedicated team for it.
Cost is a domain, like payments
Most of the mistakes in this post were made by good engineers who could write the query. What they did not have yet was the list of questions a FinOps practitioner asks before trusting a number. Some of the ones our product now encodes:
- You pay for the request, and for usage above it. A container is charged the greater of the two.
- Allocated cost is not billed cost. Freed requests are capacity until a node leaves.
- Idle and shared cost need a policy and a name. Derived by subtraction, they absorb every new cost category you forget to subtract.
- Discounts compound. 30% and then 10% is 37%, and a dashboard that adds them says 40%.
- Potential savings, overlapping savings and realized savings are three different numbers.
- Unknown is not zero. A price nobody listed, a cluster that stopped reporting and a workload with no history each need their own state.
- A budget compares actual spend, on a stated definition of cost, and that definition has to match the dashboard next to it.
The cloud side has its own. AWS applies Savings Plans per hour across the billing family, "to the usage with the highest savings percentage first", so which node received a discount is an output of the billing run and nothing in the cluster can observe it. The Cost and Usage Report only names pods if you turn on split cost allocation, and AWS's own example is 48,000 extra records a day for 1,000 pods. The FOCUS specification defines four costs for a single charge (billed, effective, list and contracted) because finance needs each for a different purpose.
A platform team can learn all of this. The honest estimate should include the months it takes, and who on the team will own the answer when finance asks why two reports disagree.
Where that leaves the decision
Martin Fowler's test still holds: software is either a utility or part of what makes you better than your competitors. A cost tool is a utility for almost everyone.
There is a small case where building is still right. You run one cloud and one CNI, you already operate Prometheus, nobody is charged back, and the questions fit on one screen. OpenCost is a CNCF project with an active repository, and it is where our own first version started.
What does not shrink with scope is the class of bug that produces a believable wrong number. Request versus usage, idle capacity, Jobs and volumes counted twice, day boundaries, the run rate of something young, a recommendation that ignores the autoscaler: each of these is silent, and each applies to a single cluster. Finding them, and keeping them found while kernels, clouds and Kubernetes change underneath, is where our weeks go. It is what you are paying for when you buy.
Kubeadapt is one Helm chart and shows cost in about five minutes.
Sources
- McKinsey: The state of AI in 2026
- METR: Frontier Risk Report (May 2026)
- METR: Measuring AI ability to complete long tasks (March 2025)
- ClickHouse: Shopify observability at global scale
- The Pragmatic Engineer: Datadog's $65M/year customer mystery solved
- Kubernetes: Horizontal Pod Autoscaling
- Datadog: State of Cloud Costs 2024
- New Relic: 2025 Observability Forecast
- AWS: How Savings Plans apply to your usage
- AWS: Split cost allocation data
- Datadog: Hardening eBPF for runtime security
- DataDog/datadog-agent pull request 39432
- Linux: seccomp: passthrough uretprobe systemcall without filtering
- LWN: The trouble with the new uretprobes
- FOSDEM 2026: Performance and reliability pitfalls of eBPF
- pixie-io/pixie issue 1612
- grafana/pyroscope issue 3673
- KEN: Kernel Extensions using Natural Language (arXiv 2312.05531)
- Characterizing and Bridging the Diagnostic Gap in eBPF Verifier Rejections (arXiv 2607.02748)
- DepSurf: Revealing the Unstable Foundations of eBPF-Based Kernel Extensions (EuroSys 2025)
- The Register: Even Netflix struggles to identify and understand the cost of its AWS estate
- Martin Fowler: UtilityVsStrategicDichotomy
- OpenCost
- hjacobs/kube-resource-report
- Teevity/ice