The question arrives in the first week of the month: what did Kubernetes cost, and why is it higher than last time? The person asking does not have a login to the dashboard and does not want one. They want a document they can read in the budget review and file afterwards. So someone on the platform team takes screenshots, pastes them into slides, and writes the explanation by hand.
Reports is now available in Kubeadapt, and it writes that document for you.
What Reports does
You choose what the report covers (the whole organization, one cluster, a department, a team or a single namespace) and the period. Kubeadapt turns that into a PDF: the total, how it compares with the period before, why it moved, who spent it, and which savings are open. You can generate one when you need it, or have it written and sent every week, month or quarter.
The figures in a document are frozen when it is generated. The copy finance opened on the 2nd says the same thing when someone opens it again in March.
There are two formats, because two kinds of reader ask about cost. Both are built from the same data, so the two documents agree with each other.
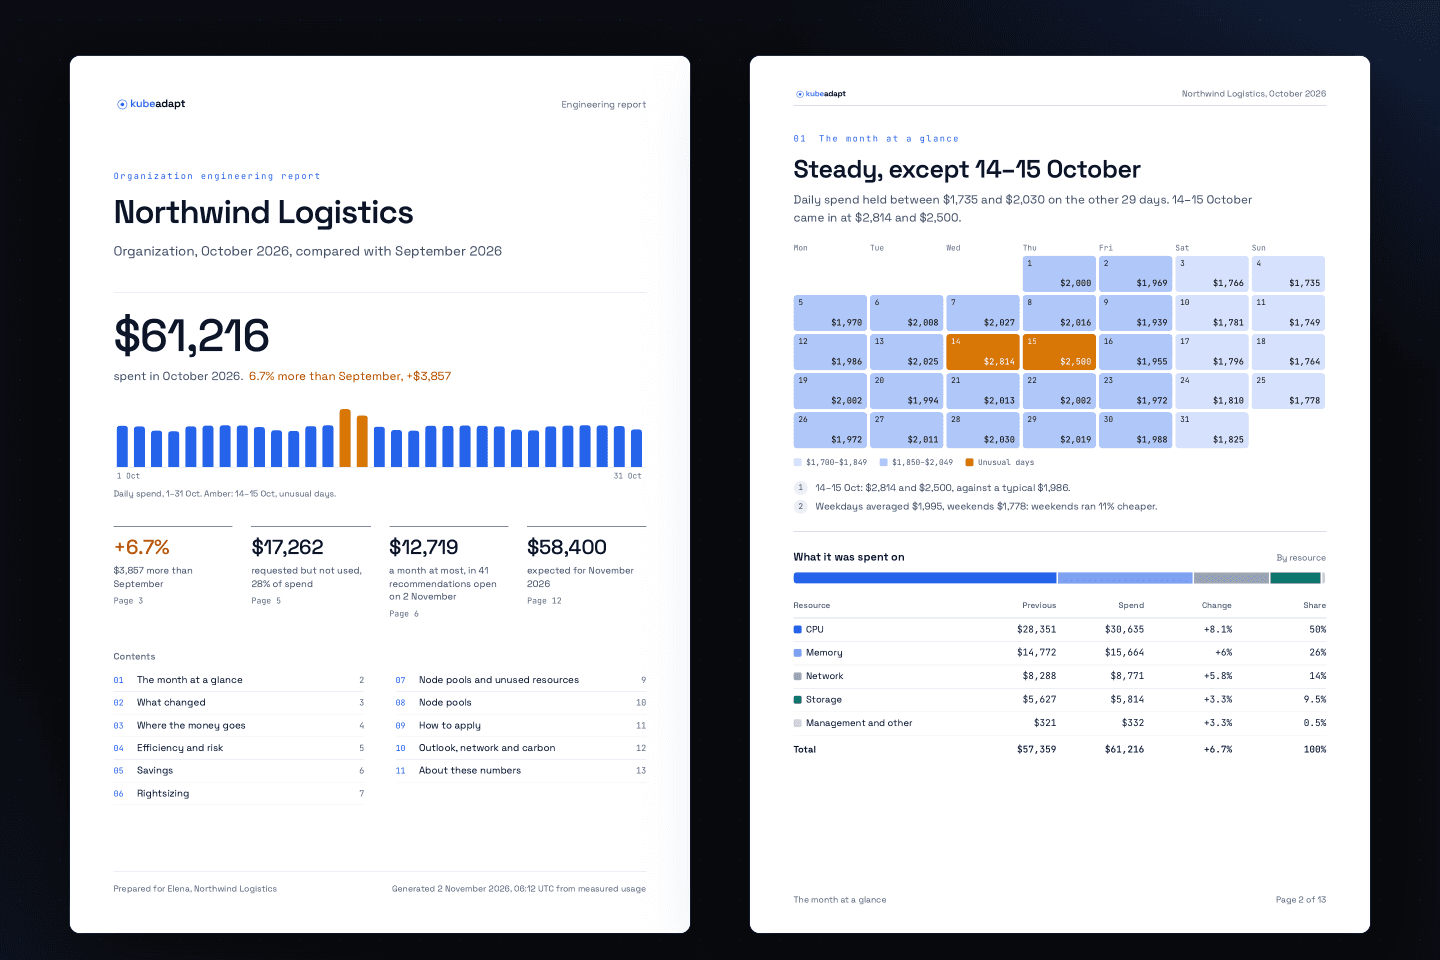 An Engineering report: the cover with the month's key figures, and the month laid out day by day.
The Executive report, for the people who approve the budget
Up to five pages, written for managers and finance:
- The key figures. The total, the change against the period before, and a bar for each day with unusual days marked.
- What changed. A waterfall from the previous total to this one, with a sentence under each part saying what drove it.
- Who spent it. A statement by department or team. Shared cluster cost and unallocated cost are their own lines, so the page adds up to the total on the cover.
- Efficiency and outlook. How much of the requested CPU and memory was used, and what next month is expected to cost, with a range.
- Savings to decide on. The largest open recommendations, by kind.
The Engineering report, for the people who can change it
The same month, with the detail a platform team needs to act:
- Where the money goes, by cluster, namespace and workload, with the change for each.
- Requests nobody used, priced, with the workloads where the gap is largest, and next to them the workloads that use more memory than they request.
- Every open recommendation by kind. Rightsizing has one row per workload with CPU and memory from and to. Node pool changes read as instructions. Unused volumes and load balancers are named.
- How to apply each kind of change, as written steps with the risks recorded for it.
- Network cost by billing class, where network traffic is measured.
- About these numbers. The last page explains how every figure in the document was made.
In both formats a section with no data for the scope is left out. Nothing is printed empty.
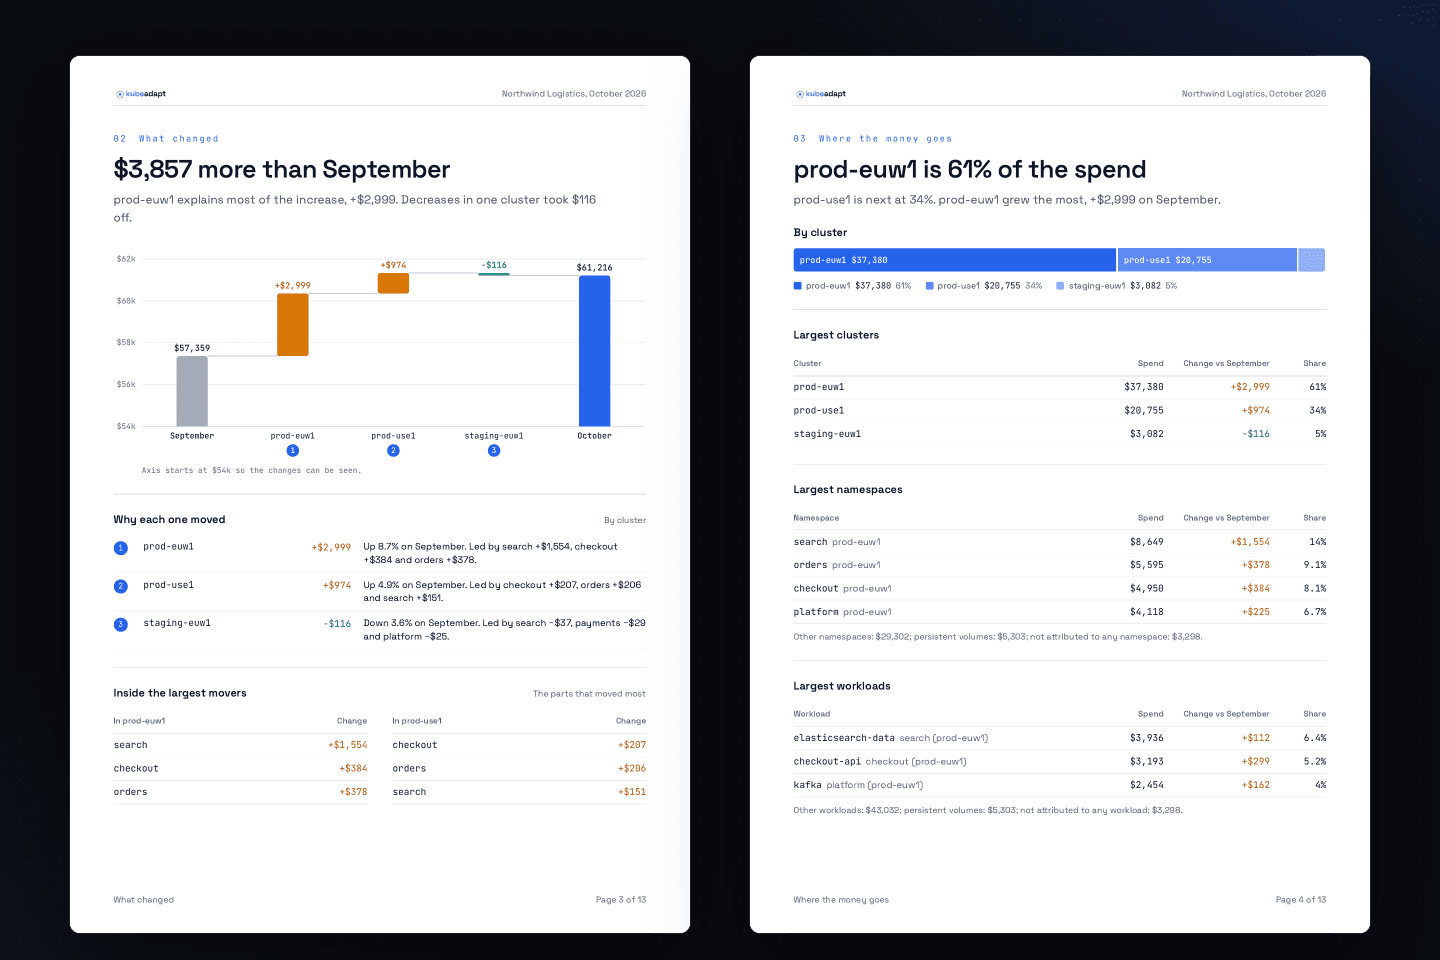 What changed between two months, and where the money goes by cluster, namespace and workload.
One month, four answers
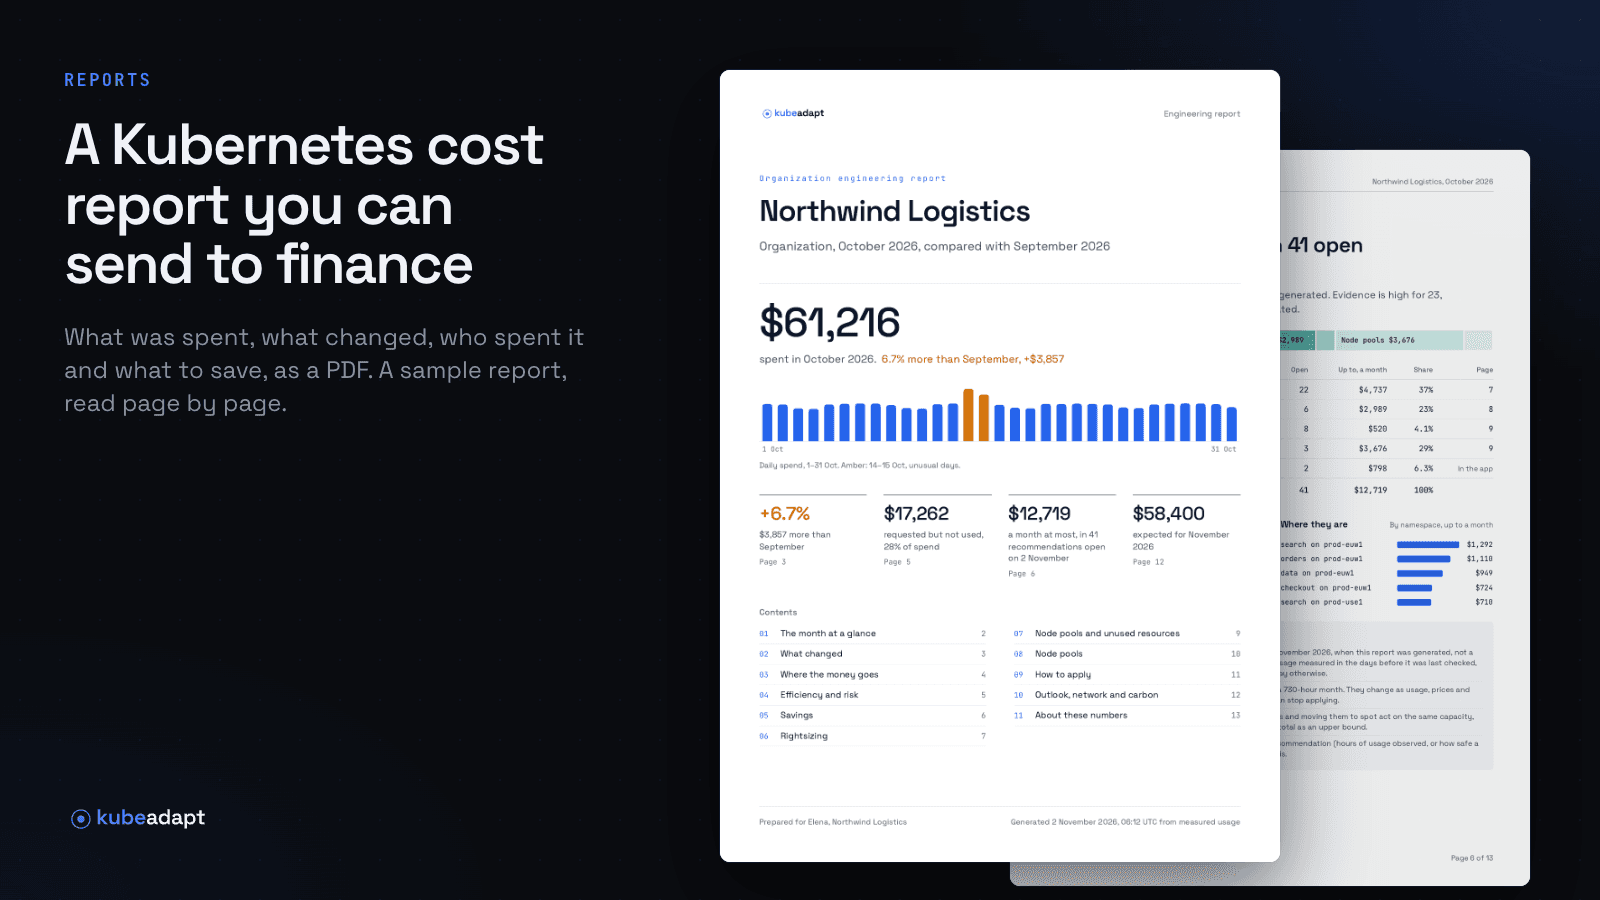
Here is what a report says, using a sample we made for a made-up company, Northwind Logistics. The company is invented; the PDF came out of the same renderer your reports use.
- What did we spend? $61,216 in October, 6.7% more than September.
- Why did it go up? One cluster added $2,999, and the report says which namespace led it: "Up 8.7% on September. Led by search +$1,554, checkout +$384 and orders +$378."
- What are we paying for and not using? $17,262 of requests went unused, 28% of the month. The first row of the table is a service that requests 56 cores and uses 23.
- What can we do about it? Up to $12,719 a month in 41 open recommendations, split by kind, each with the page that lists it.
Download the full documents: the Engineering report (13 pages) and the Executive report (5 pages).
Set it up once
A report covers this month, last month, the last 7 days, last quarter, or a custom range of up to 366 days, and compares it with the period before by default.
A scheduled report runs weekly on the weekday you choose, monthly on the 1st, or quarterly. Each run covers the period that just ended and waits for the last day's cost data before it generates. When it is ready, Kubeadapt sends a link to the people you chose in your organization and to the Slack or email channels you already use for alerts. The PDF stays in Kubeadapt, so a forwarded email does not carry your cost data with it.
Access follows your clusters
A new report is private to you, your admins and its recipients. Share it, and everyone who can open every cluster it covers can see it. A document only opens for someone with access to every cluster it was built from, so a report cannot show a cluster to a person who is not allowed to open it in the app.
Every report has an owner. If the owner leaves or loses access to what the report covers, its schedule pauses and the report shows under "Needs attention" until someone takes it over.
Savings written to be read later
A PDF outlives the screen it came from. Someone opens it a quarter later, and a savings figure with no date on it has turned into a promise. So the savings pages are written to be read cold.
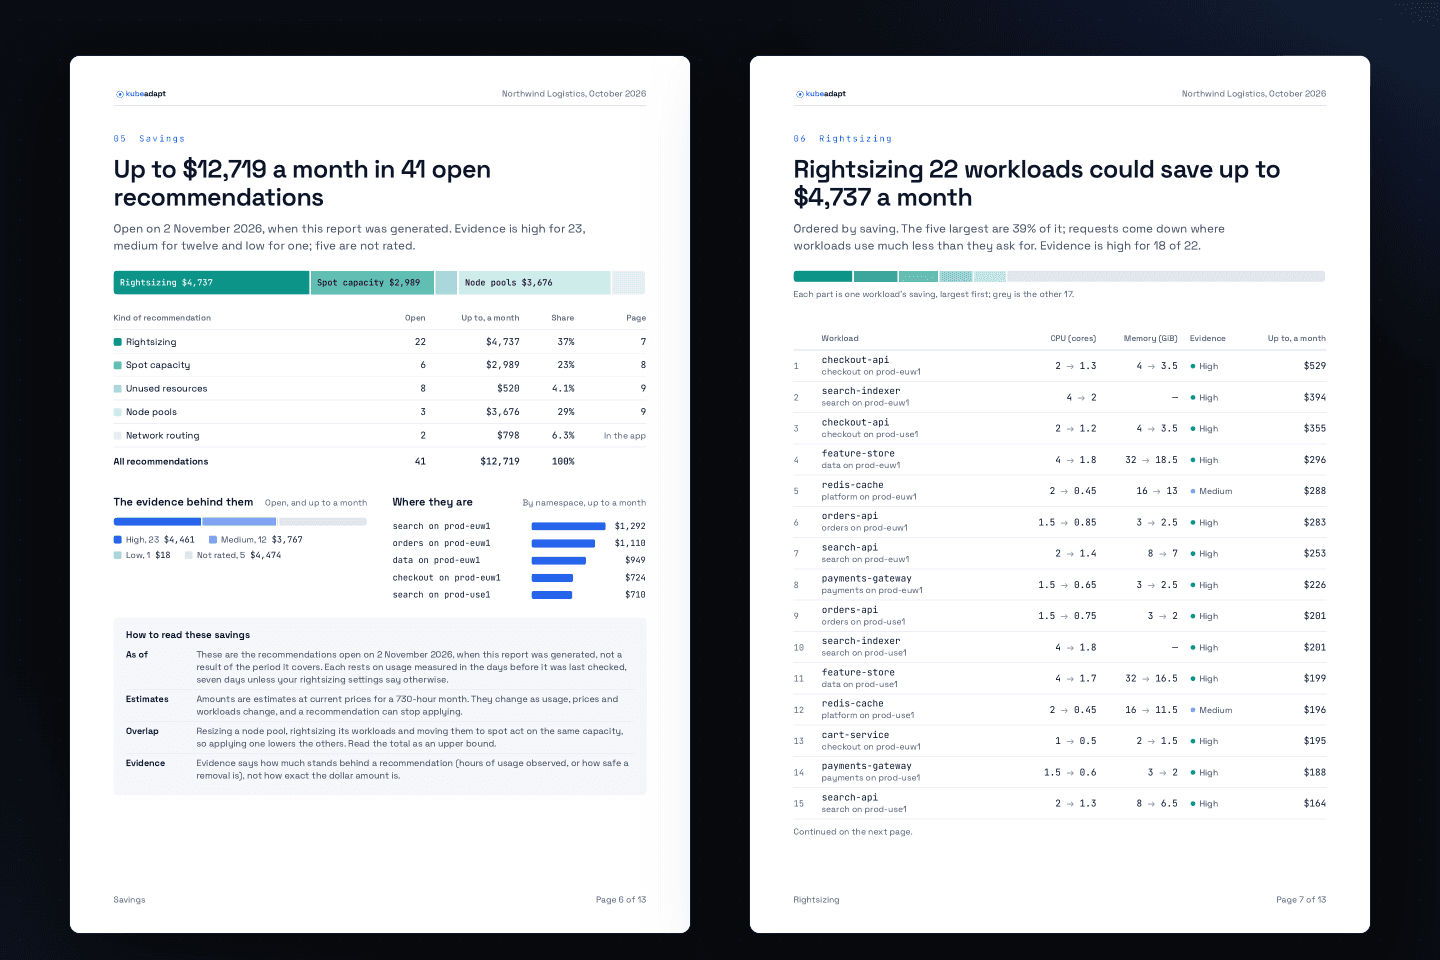 The savings summary, and the rightsizing rows that follow it.
Every amount is "up to" a monthly figure, and every savings page states the day: "Open on 2 November 2026, when this report was generated." A short block, "How to read these savings", says that the amounts are estimates for a 730-hour month, and that recommendations acting on the same capacity overlap, so the total is an upper bound. Each recommendation also shows its evidence as High, Medium or Low: how much observation stands behind it.
Carbon reports in GreenOps
GreenOps has its own reports, written for a different reader: the person putting together the company's emissions disclosure. Under GreenOps you can create five of them, for any range of up to 12 months, for the whole organization or a single cluster:
- GHG inventory statement. Emissions by scope, with both Scope 2 methods (location-based and market-based) side by side, by cluster, with the method and every factor used.
- ESRS E1 data pack. Energy use and gross greenhouse gas emissions, arranged by the climate disclosure topics of ESRS E1.
- IFRS S2 and TSRS metrics. Absolute gross emissions by scope, with the measurement approach.
- Method and factor register. How the figures are calculated, and every emission factor behind them with its source.
- Activity data. Energy and emissions per day, cluster, namespace and workload, for your own analysis.
Each one downloads as a PDF, and as a spreadsheet, CSV or JSON where you need the tables themselves. A report says whether it is final or provisional, and what is counted and what is not. Every figure is an estimate in tonnes of CO₂ equivalent.
Where to find it
Reports is in the sidebar. With no reports yet, the page offers two starting points: a monthly Executive report for your organization and a weekly Engineering report for one cluster. The details are in the Reports docs.