Emre Kasgur
The FinOps Foundation's maturity model (Crawl, Walk, Run) was designed for cloud resources where cost attribution is straightforward. Tag an EC2 instance, see what it costs, assign it to a team. Kubernetes breaks that assumption at every level.
A single node runs 40 pods from 12 teams. Resource requests don't match actual usage by a factor of 4x. And 40% of teams running Kubernetes have no cost monitoring at all.
The maturity model still applies. But every capability (visibility, allocation, optimization, governance) looks different when your infrastructure is shared, ephemeral, and abstracted away from the cloud bill.
This post maps the Crawl-Walk-Run framework to five concrete dimensions of Kubernetes cost management, with specific indicators, real numbers, and practical tooling at each stage.
But before you read further, take two minutes and score yourself. We put together 20 questions across four categories. You'll get a lot more out of the rest of the post if you know where you're starting from.
How mature is your Kubernetes FinOps?
20 questions, takes about 2 minutes.
What tools and infrastructure do you have in place?
1.Is VPA (Vertical Pod Autoscaler) installed in any of your clusters?
2.Do you have a Kubernetes cost monitoring tool (OpenCost, Kubecost, or similar)?
3.How are your cluster nodes managed?
4.What percentage of your compute runs on spot or preemptible instances?
5.Do you have Savings Plans or Reserved Instances covering your Kubernetes compute?
The Three Stages
The FinOps Foundation defines maturity per capability. You might be at "Run" for cost visibility but "Crawl" for rate optimization. That's expected.
| Stage | What It Means | Key Indicator |
|---|---|---|
| Crawl | Basic reporting, reactive. KPIs defined but not consistently met. Plans to address obvious waste. | ≥70% of spend attributed to a known owner |
| Walk | Processes followed org-wide. Automation covers most cases. Edge cases identified and deliberately deferred. | ≥85% attribution, <10% forecast variance |
| Run | Automation is the default. Edge cases actively addressed. Very high KPIs across the board. | >90% attribution, <5% forecast variance |
The Foundation organizes these capabilities across four domains: Understand Usage & Cost, Quantify Business Value, Optimize Usage & Cost, and Manage the FinOps Practice. That's 22 capabilities.
For Kubernetes, three of these map cleanly. The Quantify Business Value is where most teams get stuck. Figuring out your cost per API request or cost per customer requires cost attribution and cost attribution is the thing Kubernetes makes genuinely hard.
Why Kubernetes Makes FinOps Harder
Kubernetes eliminates that 1:1 relationship between a billing entity and a workload.
The FinOps Foundation's own Container Costs working group states it plainly: "In the containerized world, traditional FinOps cost allocation doesn't work. You can't simply allocate the cost of a resource to a tag or label, because resources may be running multiple containers, with each supporting a different application."
Three things make this structurally different from VM-level FinOps.
Shared infrastructure. A typical production node runs pods from multiple teams. One line item on your bill, twelve teams using it. Attributing that cost to individual workloads requires knowing each pod's resource requests (or actual usage), the node's total capacity and some method for handling shared overhead: control plane fees, monitoring agents, DaemonSets, ingress controllers. There's no standard way to split these.
The request-usage gap. Kubernetes schedules pods based on resource requests, not actual usage. A pod requesting 1 CPU but using 200m still reserves the full core. Cast AI's 2025 benchmark across 2,100 organizations found that average CPU utilization is 10%. 82% of workloads are overprovisioned. Only 7% have accurate resource requests.
Ephemeral workloads. Containers don't stick around. Datadog reports the average container lifespan is one day. The scheduler moves pods across instance types, availability zones, sometimes even regions. Good luck tracking that with a monthly billing spreadsheet.
Five Dimensions of Kubernetes FinOps Maturity
The Foundation's 22 capabilities are a useful reference, but they were written for all of cloud, not just Kubernetes. We've found it more practical to assess maturity across five dimensions that map directly to the engineering decisions you actually make day-to-day.
| Dimension | Crawl | Walk | Run |
|---|---|---|---|
| Resource Requests | Defaults or missing. Only 7% accurate. | VPA in recommendation mode, regular review. | VPA auto-apply, admission webhooks enforce. |
| Cost Visibility | Account-level cloud bill only. | Namespace-level attribution, showback. | Real-time dashboards, anomaly detection. |
| Rate Optimization | 100% on-demand. <8% spot. | Savings Plans + spot for stateless. | 78%+ spot, ARM adoption, Karpenter. |
| Autoscaling | Static node pools, no scale-down. | HPA + Cluster Autoscaler, non-prod scheduled. | Karpenter consolidation, >60% utilization. |
| Governance | No cost ownership. | Team budgets, monthly reviews. | Policy-as-code, cost as engineering metric. |
Each of these has a different effort-to-reward curve. Resource requests and autoscaling tend to deliver the biggest dollar savings with the least organizational friction. Governance and cost visibility need buy-in from multiple teams, but they create the foundation for everything else. Rate optimization is pure math: configure the tools, let them work.
Let's go through each one.
1. Resource Requests and Limits
This is where most of the money is. If your pods request 4x what they actually use (and 82% of them do), then right-sizing saves more than any rate optimization or commitment discount ever will.
| Stage | What It Looks Like |
|---|---|
| Crawl | Most pods have no requests, or copy-pasted defaults (resources: {requests: {cpu: "1", memory: "2Gi"}} everywhere). Teams set values high "just in case." Only 7% of workloads have accurate settings. No VPA. |
| Walk | VPA running in recommendation mode. Tools like Goldilocks surface per-workload suggestions. Teams review recommendations and apply them on a regular cadence, monthly or per-sprint. Requests set on >80% of workloads. QoS classes understood and intentional. |
| Run | VPA auto-applying recommendations with safety bounds. Admission webhooks reject pods without resource requests. Continuous right-sizing loop with guardrails: never drop below p99 usage, respect PDB constraints. Result: one team cut CPU requests 48% and memory 39% across 1,200 pods without a single OOM kill. |
Here's the math. A single m5.xlarge on-demand costs $0.192/hour, or $1,682/year. If the pods on that node request its full 4 vCPUs and 16 GiB but actually use 1 vCPU and 4 GiB, three-quarters of the spend is waste. Across a 50-node cluster, that's $63,000/year in CPU nobody uses.
Why does this happen? Teams set requests equal to limits and limits equal to "something big enough." Nobody wants to get paged at 3 AM because a pod got OOM-killed, so they round up. Totally reasonable instinct. But the cost of that safety margin compounds across every workload, and it's almost always way bigger than anyone expects.
2. Cost Visibility and Allocation
You can't fix what you can't see. And most teams can't see much. The CNCF FinOps microsurvey found that 40% of organizations estimate their Kubernetes costs with no real monitoring. Another 38% have no cost visibility at all. Only 19% actually have accurate cost data.
| Stage | What It Looks Like |
|---|---|
| Crawl | Cloud bill viewed at the account level. Kubernetes costs are a black box. You know what your EKS cluster costs in total, but not how that breaks down by team, namespace, or workload. Cost questions answered with spreadsheets and guesswork. |
| Walk | Cost monitoring deployed (OpenCost, Kubecost, or a vendor solution). Costs allocated by namespace and label. Showback reports sent to engineering teams monthly or weekly. ≥85% of spend attributed to a known owner. Shared costs (control plane, monitoring, DaemonSets) distributed by a documented formula. |
| Run | Real-time cost dashboards per team and service. Chargeback integrated with finance systems. Unit economics tracked: cost per API request, cost per customer, cost per transaction. Anomaly detection fires alerts when a workload's cost deviates from its 30-day baseline. >90% of spend attributed. |
The Crawl-to-Walk jump is the single highest-impact move here. Going from "we have no idea" to "here's what each team spends" typically surfaces $10,000 to $50,000/month in obvious waste. Forgotten staging environments. Oversized dev clusters. Zombie deployments that haven't served a single request in months.
Cost allocation is often more political than technical. "Should we charge Team A for the shared Prometheus stack they didn't ask for?" has no correct answer. Pick a method (proportional to requests, proportional to usage, even split, or full absorption by the platform team), document it, and move on. Debating the perfect allocation model is a form of procrastination that delays real optimization.
3. Rate and Commitment Optimization
This dimension covers what you pay per unit of compute: on-demand pricing vs. Savings Plans vs. Reserved Instances vs. Spot.
| Stage | What It Looks Like |
|---|---|
| Crawl | Everything runs on-demand. No Savings Plans or Reserved Instances. Spot usage below 8%. Datadog found that only 29% of organizations cover more than half their eligible spend with commitment discounts. |
| Walk | Compute Savings Plans covering baseline steady-state usage. Spot instances for fault-tolerant workloads (batch jobs, stateless services with multiple replicas). Instance type modernization, migrating from previous-gen (m5) to current-gen (m7g) for better price-performance. |
| Run | 78%+ spot penetration with automated fallback to on-demand. Savings Plans sized to cover the minimum sustained floor, not the average. Graviton/ARM adoption where workloads support it. Datadog reports Graviton adopters run 18% of their compute on ARM, at roughly 20% lower cost per unit. Karpenter selecting optimal instance types and purchase options automatically. |
Most teams assume spot is too risky. "What if my pods get terminated?" Fair concern, but Kubernetes already handles rescheduling. Add PodDisruptionBudgets, graceful shutdown handlers, and multiple replicas, and most stateless workloads survive spot interruptions without anyone noticing. The financial services team that saved £1.2M annually ran 78% of their workloads on spot across 28 EKS clusters. Financial transactions. On spot. It works.
Here's a detail most teams miss: commitment discounts and spot aren't mutually exclusive. Savings Plans cover your baseline (the compute you'll use no matter what). Spot covers the variable portion on top. The mistake teams make at Crawl is buying Savings Plans based on average usage instead of minimum sustained usage, and then wasting money when demand dips below the commitment.
4. Autoscaling and Right-Sizing
This is where Kubernetes actually has an advantage over traditional infrastructure. The primitives are all there: HPA, VPA, Cluster Autoscaler, Karpenter. The hard part is configuring them for cost efficiency, not just performance. Those are two different objectives, and they often pull in opposite directions.
| Stage | What It Looks Like |
|---|---|
| Crawl | Static node pools sized for peak traffic. Cluster Autoscaler installed with default settings, or not installed at all. Non-production environments run 24/7 at production scale. Off-peak cluster utilization below 15%. |
| Walk | HPA configured for key workloads with CPU/memory targets. Cluster Autoscaler tuned (scale-down delay, utilization threshold). Non-prod environments scheduled to scale down outside business hours. Node utilization improved to 30-50%. |
| Run | Karpenter replacing Cluster Autoscaler, with consolidation actively migrating pods to pack nodes tighter and terminating underutilized nodes. HPA and VPA coordinated. Workload-aware bin-packing. Node utilization above 60%. Result: a SaaS company cut from $52K/month to $23K/month, a 56% reduction. |
A simplified Karpenter NodePool that demonstrates cost-aware provisioning:
apiVersion: karpenter.sh/v1
kind: NodePool
metadata:
  name: default
spec:
  template:
    spec:
      requirements:
        - key: karpenter.sh/capacity-type
          operator: In
          values: ["spot", "on-demand"]
        - key: kubernetes.io/arch
          operator: In
          values: ["amd64", "arm64"]
        - key: karpenter.k8s.aws/instance-category
          operator: In
          values: ["m", "c", "r"]
        - key: karpenter.k8s.aws/instance-generation
          operator: Gt
          values: ["5"]
      nodeClassRef:
        group: karpenter.k8s.aws
        kind: EC2NodeClass
        name: default
  disruption:
    consolidationPolicy: WhenEmptyOrUnderutilized
    consolidateAfter: 30s
  limits:
    cpu: "1000"
    memory: 1000Gi
The line that matters is consolidationPolicy: WhenEmptyOrUnderutilized. Karpenter continuously evaluates whether pods could be packed onto fewer nodes. If a more efficient layout exists, it cordons the underutilized node, drains its pods, and terminates it. In practice, this eliminates 40-60% of idle nodes during off-peak hours without any manual intervention.
VPA and HPA can conflict. If HPA scales on CPU utilization and VPA changes the CPU request, HPA's utilization percentage shifts, potentially triggering unexpected scale-up or scale-down events. The safe pattern: use VPA for setting resource requests and HPA with custom metrics (requests per second, queue depth) rather than resource utilization percentages.
5. Governance and Engineering Culture
You can install all the right tools and still waste money if nobody looks at the dashboards. The CNCF microsurvey found that 68% of respondents believe improving team awareness would be the most effective cost reduction strategy. Not better tools. Awareness. The top overspend factors were overprovisioning (70%) and lack of individual/team cost awareness (45%).
| Stage | What It Looks Like |
|---|---|
| Crawl | No cost ownership model. Engineers don't know what their workloads cost. The platform team absorbs the entire cloud bill. Nobody gets paged for a cost spike, only for an outage. |
| Walk | Cost reports shared with engineering leads. ResourceQuotas set per namespace. Cost discussed in sprint retrospectives. Teams have budgets, even informal ones. The platform team runs monthly cost reviews with top-spending teams. |
| Run | Cost is a first-class engineering metric, tracked alongside latency and error rate. Policy-as-code enforcement via OPA or Kyverno: pods without resource requests are rejected at admission. Automated guardrails prevent deploying workloads with requests exceeding 2x their historical p99 usage. |
The Crawl-to-Walk transition here is cultural, not technical. It starts with one dashboard and one conversation: "Team X, your namespace costs $8,400/month. Here's the breakdown. Did you know?"
We've seen that conversation go three ways. Surprise: "we had no idea." Defensiveness: "we need all those resources." Or, most commonly, the sheepish grin: "oh, we forgot to delete that staging deployment three months ago." The sheepish grin is where the quickest wins hide.
The Run Trap
Rob Martin, one of the framework's authors at the FinOps Foundation, says something we agree with: "The goal is not to be at 'Run' maturity in all (or indeed any) of your Capabilities."
He talks about a Global 50 company that deliberately uses a Crawl-level allocation process. Not because they haven't invested. Because their simple approach works well enough, and the engineering effort to build something fancier just isn't worth it for them.
Same thing with Kubernetes. If your cluster is 10 nodes and $3,000/month, building a real-time chargeback system with anomaly detection and policy-as-code guardrails is over-engineering. The return isn't there. Spend your effort on the dimension with the biggest dollar impact (usually resource requests and autoscaling) and leave the rest at Walk or even Crawl.
Think of the maturity model as a map, not a scoreboard.
What Matters More Than Your Score
Here's the number that actually matters: 83% of container spend goes to idle resources. Not misconfigured. Not overpriced. Just idle. Sitting there, allocated to pods that don't need it, burning money quietly in the background.
Datadog broke this waste down into two buckets, and the split matters because it tells you exactly where to point your effort.
54% is cluster-level waste. Too many nodes, or nodes that are too large. That's the autoscaling problem. Fix it with Karpenter, consolidation, and spot.
29% is workload-level waste. Pods requesting more CPU and memory than they actually use. That's the resource requests problem. Fix it with VPA and real usage data.
Add those up and you get $106,000 in annual waste per 50-node cluster, according to Cast AI's benchmark across 2,100 organizations.
If your cluster runs at 10% CPU utilization (that's the industry average right now), moving to even 30% reclaims two-thirds of your wasted spend. That single improvement matters more than perfecting your maturity score across all five dimensions.
So here's the one thing you can do today. Measure your request-to-usage ratios. Not cluster-wide averages, but per workload. The pods with the widest gap between "what they asked for" and "what they actually use" are your first targets. They're usually worth thousands of dollars a month, and they take minutes to find.
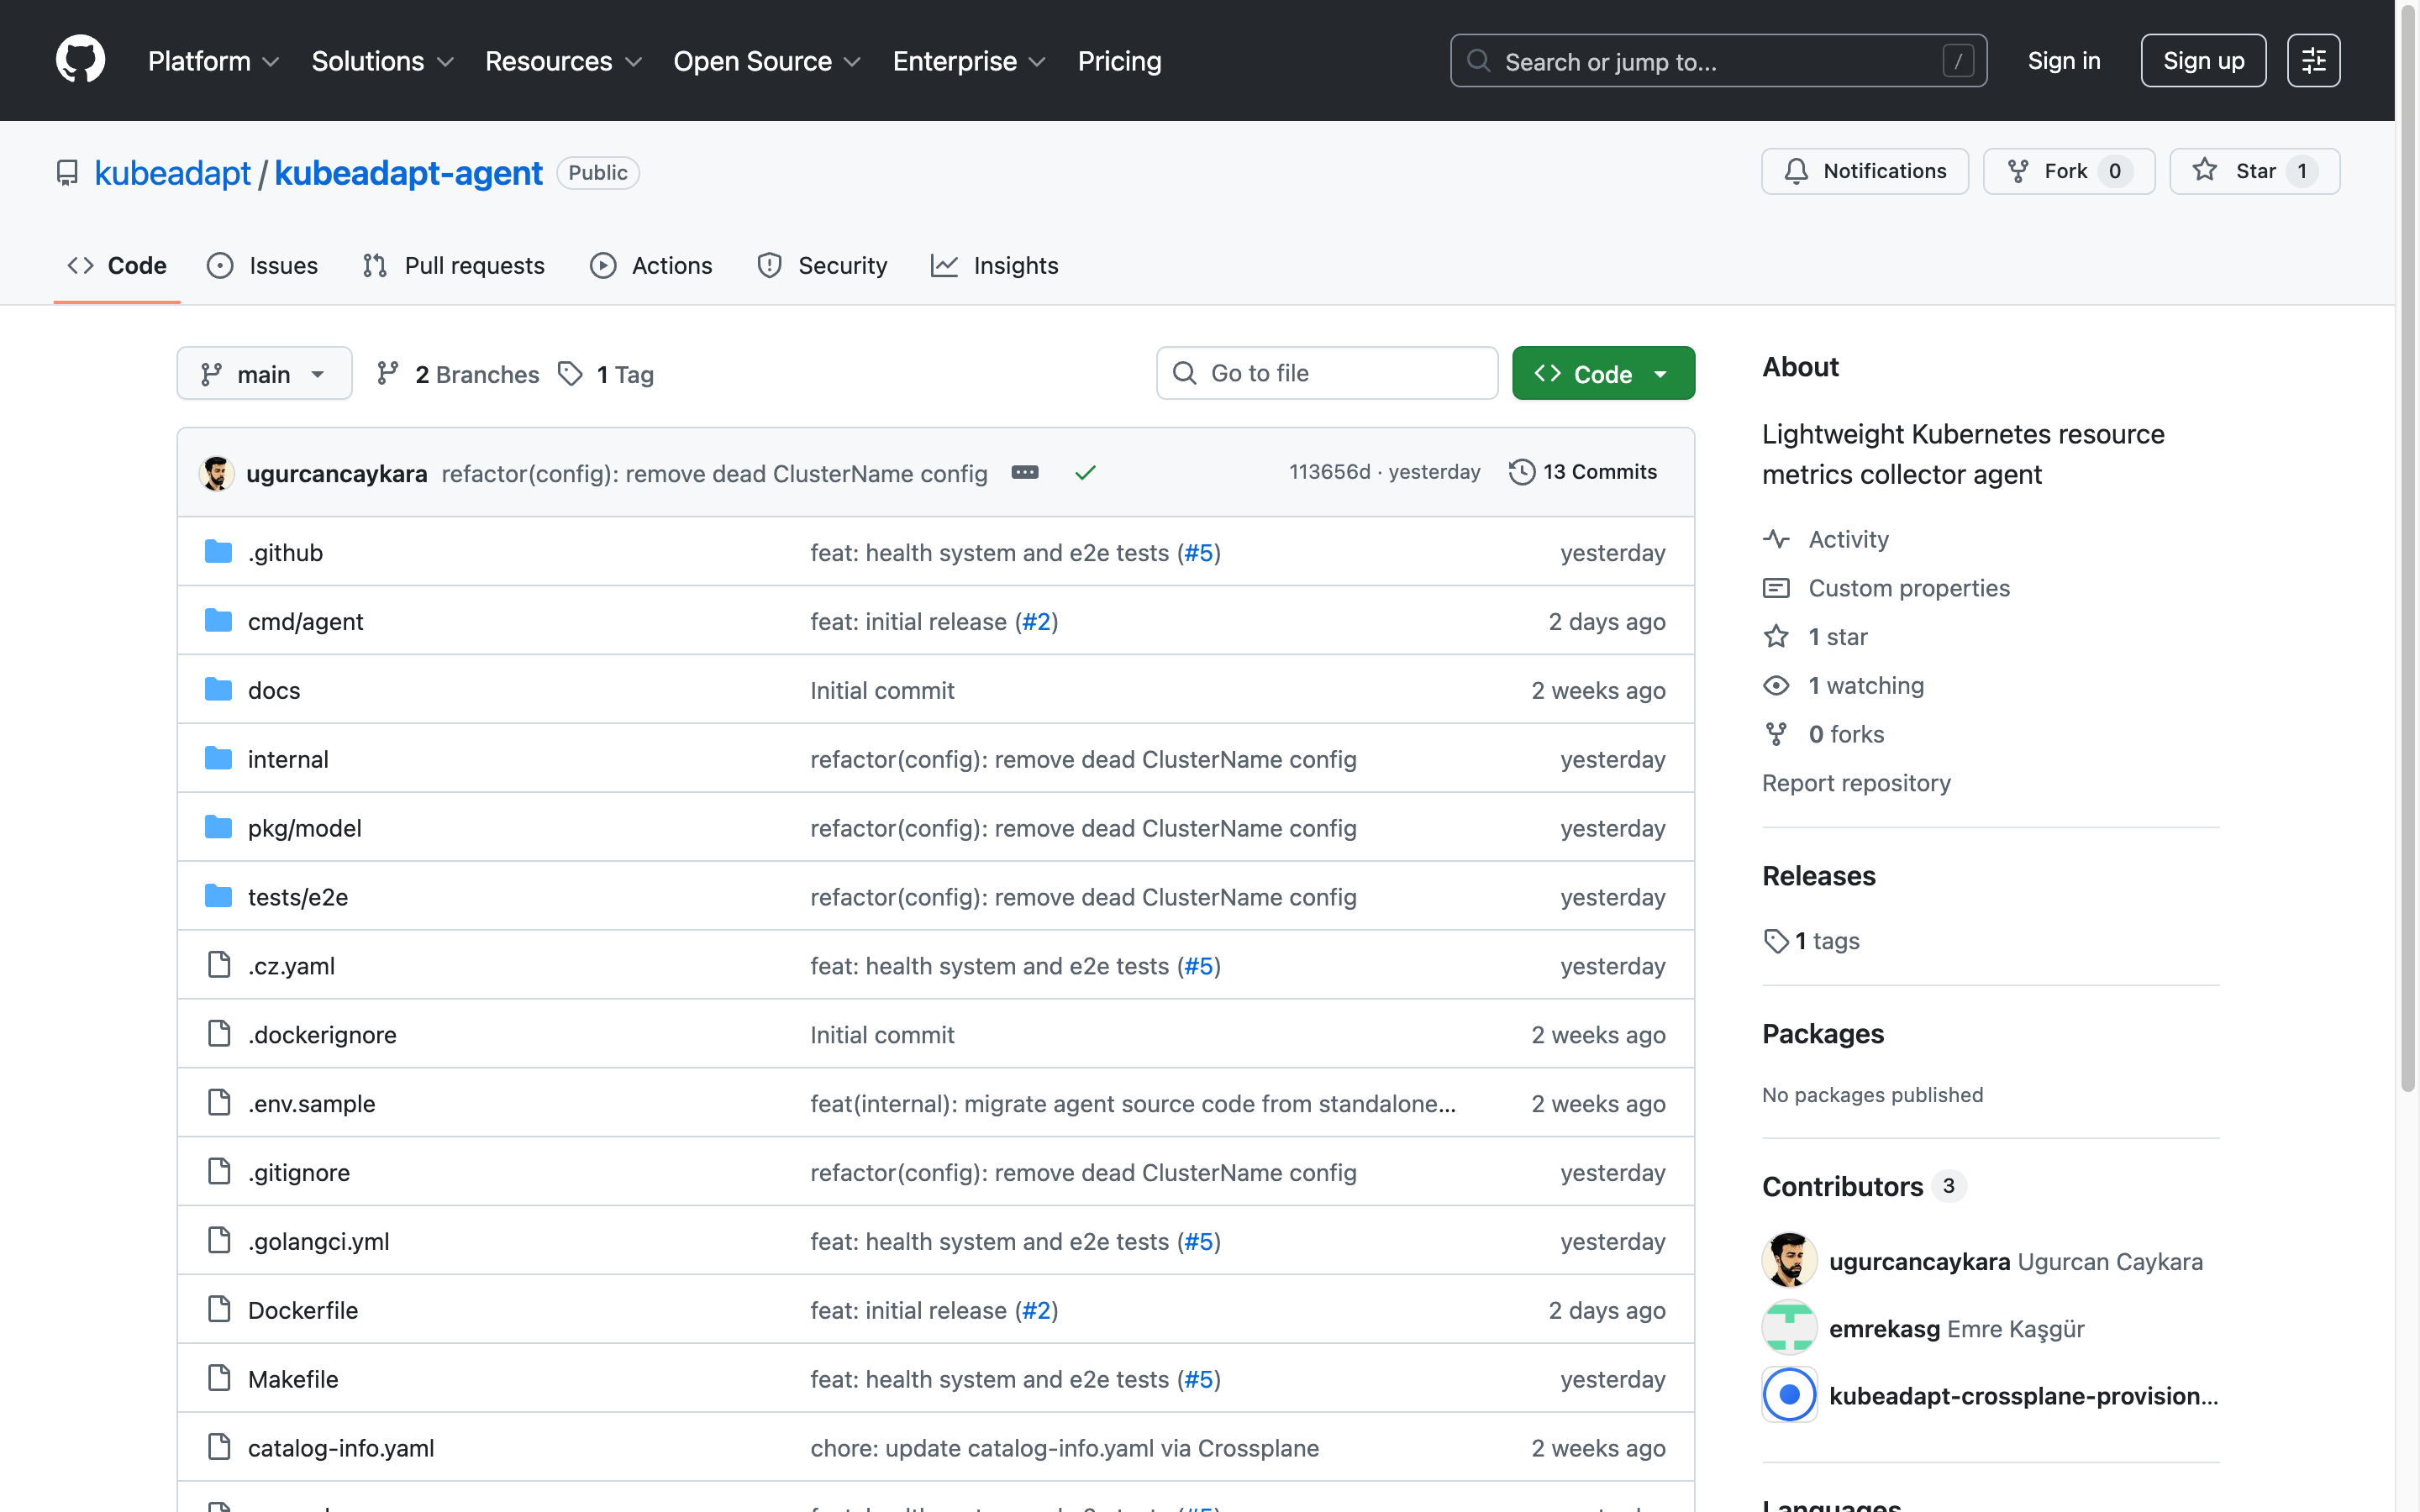
If you want those numbers for your own cluster, Kubeadapt generates them automatically. Install the agent and you'll have workload-level cost data within minutes.

Emre Kasgur
Sources & References
Further reading and cited materials
See Your Savings Potential
See exactly where your cluster spend goes and get actionable rightsizing recommendations in minutes.
10-minute setup · Works with EKS, GKE, AKS, and on-premise