Emre Kasgur
The Kubeadapt agent is the piece of our system that runs inside customer Kubernetes clusters. Its job is straightforward: figure out what's running, how much of it is being used, and send that information to our backend for cost analysis. Getting it to work reliably across different cluster sizes, cloud providers, and Kubernetes versions took longer than we expected.
This post covers the architecture we landed on: how the agent captures full cluster state every 60 seconds, why we use SharedInformers instead of polling, the streaming compression pipeline, and the security decisions we made along the way.
Why We Built Our Own Agent
The Old Stack
When we first built the agent, we went with the standard Kubernetes cost observability stack: Prometheus, OpenCost, kube-state-metrics, cAdvisor, node-exporter. Five dependencies before our agent could collect a single data point. The Helm chart's values.yaml ran over 500 lines of Prometheus scrape configs, metric relabeling rules, OpenCost pricing tables, and cloud integration secrets. Every resource type we needed (pod requests, node capacity, spot pricing, PV sizes) had a corresponding Prometheus query, a kube-state-metrics metric, or an OpenCost cost model entry, all wired together in YAML.
It worked, but started to slow down further integrations. OpenCost exposes a separate API for cloud cost data (AWS Athena/CUR, GCP BigQuery, Azure Cost Export), and there's no built-in way to apply discount pricing (Reserved Instances, Savings Plans) to specific Kubernetes nodes. This isn't just an OpenCost limitation. AWS provides RI utilization data but doesn't include exact instance IDs, so mapping discounts back to nodes requires non-trivial work. We ended up building that mapping in our own pricing engine (a topic for another post), but the point is: these gaps kept stacking up.
At some point we stepped back and looked at the full picture.
Where It Broke Down
You can get most of what you need through Prometheus and kube-state-metrics: requests, limits, node labels, instance types. But it means maintaining scrape configs, metric relabeling, and query logic across multiple exporters. With the new agent, we talk directly to the Kubernetes API and metrics-server. No intermediate metric pipeline, no PromQL, no retention tuning. The data model is simpler and the moving parts are fewer.
On the cost attribution side, OpenCost was built for self-hosted setups. Our SaaS platform needed tighter control over pricing logic. Every edge case (spot pricing, multi-cloud normalization, discount mapping) meant pushing customers through more config instead of solving it ourselves. The cognitive load went both directions: we were debugging pricing mismatches instead of building features, and customers had to review Prometheus retention settings and RBAC definitions across five separate components instead of a single Helm chart.
We moved cost attribution entirely into the Kubeadapt SaaS platform. We built our own cost engine that handles spot and on-demand pricing out of the box, no customer-side cloud integrations required. The agent's job became simpler: collect cluster state, send it. The backend does the rest.
From Prometheus to Cluster State
We moved to a different model: capture the full cluster state directly. The agent takes a complete snapshot of every node, pod, workload, and autoscaler, then sends it. The backend does the analysis. The only external dependency is metrics-server, for actual CPU and memory usage.
The Result
The old Helm chart deployed Prometheus, OpenCost, kube-state-metrics, node-exporter, and our agent. Resource requests alone totaled 3+ CPU cores and 5+ GB of memory. The new chart deploys one container. Requests: 100m CPU, 128Mi memory.
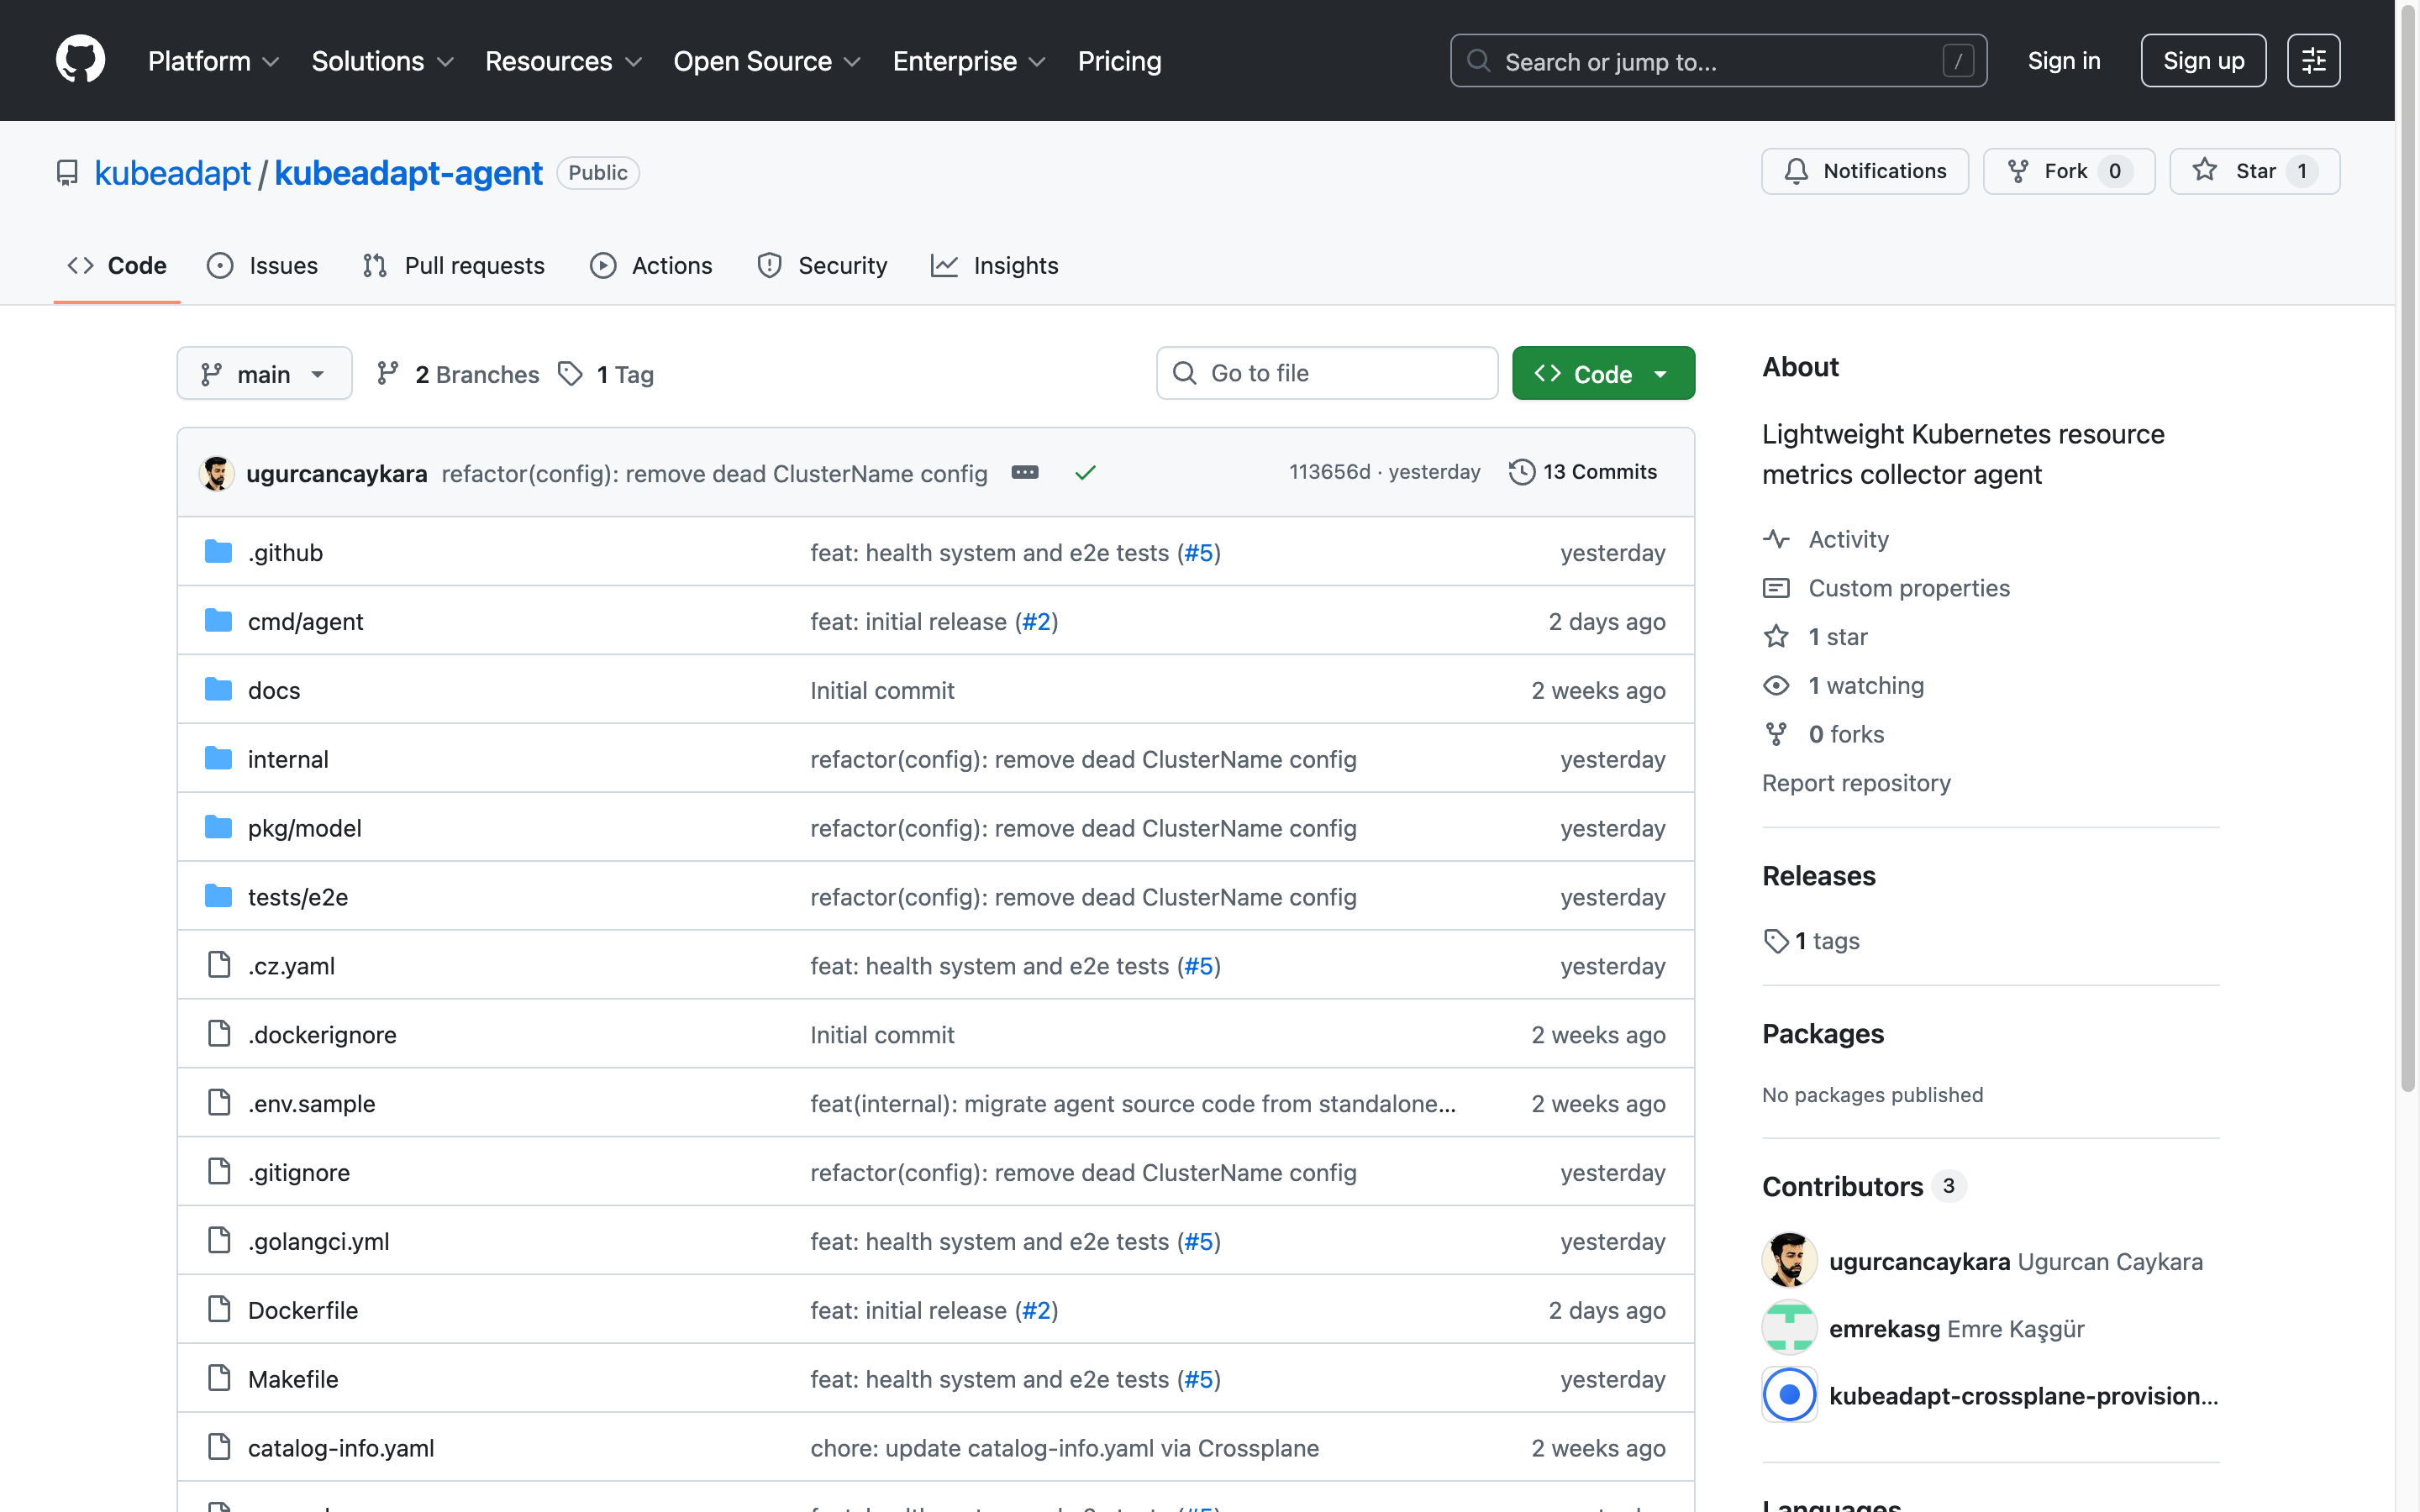
The agent today is a single binary, deployed as a single-replica Deployment, with no external dependencies beyond the Kubernetes API server and metrics-server. Install it with helm install, point it at our backend, done.
The Cluster Snapshot
Every 60 seconds, the agent builds a ClusterSnapshot: a complete, point-in-time representation of every resource relevant to cost optimization. The Go struct:
type ClusterSnapshot struct {
    // Identity
    SnapshotID     string `json:"snapshot_id"`
    ClusterID      string `json:"cluster_id"`
    Timestamp      int64  `json:"timestamp"`
    AgentVersion   string `json:"agent_version"`

    // Cloud provider — detected via AWS/GCP/Azure IMDS probe at startup
    Provider          string `json:"provider"`
    Region            string `json:"region"`
    CloudAccountID    string `json:"cloud_account_id"`
    KubernetesVersion string `json:"kubernetes_version"`

    // Core resources — the cost attribution building blocks
    Nodes           []NodeInfo           // capacity, allocatable, usage, instance type, spot/on-demand
    Pods            []PodInfo            // containers, requests, limits, actual usage, owner refs
    Namespaces      []NamespaceInfo      // labels, annotations
    Deployments     []DeploymentInfo     // replicas, strategy, selectors
    StatefulSets    []StatefulSetInfo    // volume claim templates
    DaemonSets      []DaemonSetInfo      // per-node workloads
    Jobs            []JobInfo            // completions, owner cronjob
    CronJobs        []CronJobInfo        // schedule, last run
    CustomWorkloads []CustomWorkloadInfo // Argo Rollouts, etc.

    // Autoscaling context — critical for safe recommendations
    HPAs []HPAInfo // target utilization, min/max replicas
    VPAs []VPAInfo // VPA recommendations (omitted if CRDs not installed)
    PDBs []PDBInfo // disruption budgets — don't downsize what can't be disrupted

    // Network
    Services  []ServiceInfo // selectors, ports
    Ingresses []IngressInfo // hosts, paths

    // Storage
    PVs            []PVInfo           // capacity, storage class, status
    PVCs           []PVCInfo          // bound PV, access modes
    StorageClasses []StorageClassInfo // provisioner, parameters

    // Scheduling constraints
    PriorityClasses []PriorityClassInfo // preemption policies
    LimitRanges     []LimitRangeInfo    // default requests/limits per namespace
    ResourceQuotas  []ResourceQuotaInfo // namespace quotas
    NodePools       []NodePoolInfo      // Karpenter provisioners (omitted if not present)

    // Computed at build time
    Summary ClusterSummary // aggregate counts and resource totals
    Health  AgentHealth    // informer health, payload sizes, error state
}
That's 22 resource types in a single payload. The autoscaling and scheduling fields are probably the least obvious ones. HPAs tell us whether a workload is already auto-scaling (so we don't generate a conflicting recommendation), PDBs tell us how much disruption it can tolerate (so we don't suggest downsizing something that can't be restarted), and NodePools give us Karpenter provisioning config.
Secret values, ConfigMap contents, environment variables, container arguments, application data. The model types don't have fields for sensitive data. There's no code path that could accidentally include it.
How the Agent Works
Startup Sequence
Load config from environment variables. Build Kubernetes clients. Detect cluster capabilities. Register collectors. Build the enrichment pipeline. Start the health server. Run the main loop.
Two things worth calling out.
First, the agent configures Go's runtime for container environments using automemlimit and automaxprocs (more on this in Memory Management).
Second, we probe for optional capabilities before registering collectors. Not every cluster has metrics-server, VPA CRDs, or Karpenter. We call ServerGroups() on the Kubernetes discovery API to check for specific API groups (metrics.k8s.io, autoscaling.k8s.io, karpenter.sh) and only register the corresponding collectors if the group exists. For GPU monitoring, we look for nodes with nvidia.com/gpu in allocatable resources, then find dcgm-exporter pods by label. This runs once at startup. The agent adapts to whatever cluster it's deployed in.
Kubernetes API and metrics-server
The agent talks to two Kubernetes APIs. The core Kubernetes API (/api/v1, /apis/apps/v1, etc.) covers all state data: nodes, pods, deployments, autoscalers, storage, everything. We access it through client-go's SharedInformer framework, which we'll get into next.
The second is the metrics API (metrics.k8s.io/v1beta1), provided by metrics-server. This gives us actual CPU and memory usage per node and per pod, the same runtime numbers that Kubernetes itself uses for HPA scaling decisions. We use the official k8s.io/metrics client to call NodeMetricses().List() and PodMetricses("").List() on a timer:
type MetricsCollector struct {
    api          MetricsAPI
    metricsStore *store.MetricsStore
    interval     time.Duration
    // ...
}

func (c *MetricsCollector) pollNodeMetrics(ctx context.Context) {
    nodeMetricsList, err := c.api.ListNodeMetrics(ctx)
    if err != nil { return }

    for _, nm := range nodeMetricsList {
        c.metricsStore.NodeMetrics.Set(nm.Name, model.NodeMetrics{
            Name:             nm.Name,
            CPUUsageCores:    convert.ParseQuantity(nm.Usage["cpu"]),
            MemoryUsageBytes: nm.Usage["memory"].Value(),
            Timestamp:        nm.Timestamp.UnixMilli(),
        })
    }
}
Unlike the core API resources (which use informers), metrics-server doesn't support the watch verb. There's no streaming connection, so we poll every 60 seconds (configurable). Each poll makes two LIST calls: one for node metrics, one for pod metrics. If metrics-server isn't installed, the agent skips this collector entirely and the usage fields stay nil. Cost analysis still works; you just can't see the gap between requested and actually used resources.
SharedInformers, Not Polling
For all core Kubernetes resources, we don't poll. We use SharedInformers. This is the central architectural decision in the agent.
Polling means calling LIST /api/v1/pods on a timer. Every call returns the full list of every pod in the cluster. On a 2,000-pod cluster, that's a multi-megabyte JSON response per call. Multiply by 22 resource types at 60-second intervals and you're hammering the API server with significant traffic that's mostly redundant. Most of those pods haven't changed since the last poll.
An informer does something different. On startup, it makes one initial LIST to populate its local cache. Then it opens a long-lived HTTP watch connection (?watch=true) to the API server. The server pushes individual events over this connection as they happen: a pod was created, a deployment was scaled, a node was added. The informer updates its local cache incrementally. The steady-state network traffic is just the delta of what actually changed.
Our NodeCollector:
type NodeCollector struct {
    client       kubernetes.Interface
    store        *store.Store
    metrics      *observability.Metrics
    informer     cache.SharedIndexInformer
    stopCh       chan struct{}
    done         chan struct{}
    stopOnce     sync.Once
    resyncPeriod time.Duration
}

func (c *NodeCollector) Start(_ context.Context) error {
    factory := informers.NewSharedInformerFactory(c.client, c.resyncPeriod)
    c.informer = factory.Core().V1().Nodes().Informer()

    if _, err := c.informer.AddEventHandler(cache.ResourceEventHandlerFuncs{
        AddFunc: func(obj interface{}) {
            node, ok := obj.(*corev1.Node)
            if !ok { return }
            info := convert.NodeToModel(node)
            c.store.Nodes.Set(info.Name, info)
            c.metrics.InformerEventsTotal.WithLabelValues("nodes", "add").Inc()
        },
        UpdateFunc: func(_, newObj interface{}) {
            node, ok := newObj.(*corev1.Node)
            if !ok { return }
            info := convert.NodeToModel(node)
            c.store.Nodes.Set(info.Name, info)
            c.metrics.InformerEventsTotal.WithLabelValues("nodes", "update").Inc()
        },
        DeleteFunc: func(obj interface{}) {
            node, ok := obj.(*corev1.Node)
            if !ok {
                tombstone, ok := obj.(cache.DeletedFinalStateUnknown)
                if !ok { return }
                node, ok = tombstone.Obj.(*corev1.Node)
                if !ok { return }
            }
            c.store.Nodes.Delete(node.Name)
            c.metrics.InformerEventsTotal.WithLabelValues("nodes", "delete").Inc()
        },
    }); err != nil {
        return err
    }

    go func() {
        c.informer.Run(c.stopCh)
        close(c.done)
    }()
    return nil
}
We have 19 of these for core Kubernetes resources. Each collector creates its own SharedInformerFactory with a 300-second resync period (configurable via KUBEADAPT_INFORMER_RESYNC). The resync is a safety net: even if the watch connection drops and an event gets lost during reconnection, the informer will do a full re-list within 5 minutes and reconcile its cache.
For CRD-based resources like VPAs and Karpenter NodePools, we use dynamicinformer.NewDynamicSharedInformerFactory instead of the typed variant, since these resources may not have Go types available at compile time.
On top of the 19 informer-based collectors, there are 2 optional dynamic informers (VPA, NodePool) and 1 polling-based collector (metrics-server). That's 22 total, each independently feeding data into the in-memory store.
The In-Memory Store
Each informer writes to a TypedStore, a generic, concurrency-safe cache:
type TypedStore[T any] struct {
    mu          sync.RWMutex
    items       map[string]T
    lastUpdated atomic.Int64
}

func (s *TypedStore[T]) Set(key string, value T) {
    s.mu.Lock()
    s.items[key] = value
    s.mu.Unlock()
    s.lastUpdated.Store(time.Now().UnixMilli())
}

func (s *TypedStore[T]) Values() []T {
    s.mu.RLock()
    vals := make([]T, 0, len(s.items))
    for _, v := range s.items {
        vals = append(vals, v)
    }
    s.mu.RUnlock()
    return vals
}
Per-type locking is the key decision. A single mutex would create contention: the pod informer (which fires frequently on large clusters) would block the node informer, which would block the deployment informer. With per-type RWMutexes, different resource types never contend. Multiple snapshot reads also proceed concurrently via RLock.
Each store tracks lastUpdated via an atomic int64. If a store hasn't been updated in 3x the snapshot interval, we flag it as stale in the health report.
Building the Snapshot
Every 60 seconds, the builder reads all 22 stores concurrently, merges metrics, runs the enrichment pipeline, and produces a ClusterSnapshot:
func (b *SnapshotBuilder) readStores(snap *model.ClusterSnapshot) []model.ReplicaSetInfo {
    var wg sync.WaitGroup
    wg.Add(22)
    var replicaSets []model.ReplicaSetInfo

    go func() { defer wg.Done(); snap.Nodes = b.store.Nodes.Values() }()
    go func() { defer wg.Done(); snap.Pods = b.store.Pods.Values() }()
    go func() { defer wg.Done(); snap.Namespaces = b.store.Namespaces.Values() }()
    go func() { defer wg.Done(); snap.Deployments = b.store.Deployments.Values() }()
    // ... 18 more goroutines ...
    go func() { defer wg.Done(); replicaSets = b.store.ReplicaSets.Values() }()

    wg.Wait()
    return replicaSets
}
ReplicaSets are read but excluded from the final payload (they're only needed for the enrichment step below). After reading stores, the builder merges metrics-server data (CPU and memory usage) into nodes and pods via lookup maps. If metrics-server isn't available, usage fields stay nil. GPU metrics follow the same pattern.
The Enrichment Pipeline
Raw informer data isn't enough. We need derived data that connects resources to each other. The pipeline is a sequential chain of enrichers:
type Enricher interface {
    Name() string
    Enrich(snapshot *model.ClusterSnapshot) error
}
Ownership resolution is the most important. In Kubernetes, a pod's direct owner is usually a ReplicaSet, not a Deployment. The chain goes Pod → ReplicaSet → Deployment. Similarly, Pod → Job → CronJob. The enricher walks these chains to find the top-level owner:
func (o *OwnershipEnricher) resolveOwner(
    pod *model.PodInfo,
    rsMap map[string]model.ReplicaSetInfo,
    jobMap map[string]model.JobInfo,
) {
    kind := pod.OwnerKind
    name := pod.OwnerName
    ns := pod.Namespace

    for depth := 0; depth < maxOwnerDepth; depth++ {
        resolved := false
        switch kind {
        case "ReplicaSet":
            key := fmt.Sprintf("%s/%s", ns, name)
            rs, ok := rsMap[key]
            if !ok || rs.OwnerKind == "" { break }
            kind = rs.OwnerKind
            name = rs.OwnerName
            resolved = true
        case "Job":
            key := fmt.Sprintf("%s/%s", ns, name)
            job, ok := jobMap[key]
            if !ok || job.OwnerCronJob == "" { break }
            kind = "CronJob"
            name = job.OwnerCronJob
            resolved = true
        }
        if !resolved { break }
    }

    pod.OwnerKind = kind
    pod.OwnerName = name
}
Without ReplicaSets in the store, this chain would break at the first hop.
Aggregation sums pod-level resources per workload. Targets matches PDBs and Services to workloads by label selector. Mounts associates PVC mounts to pods. Each enricher logs a warning on failure but doesn't block the others.
Streaming Compression
A snapshot for a 100-node cluster can be 5–10 MB of JSON. We use zstd streaming compression, typically achieving 8–12x ratios.
What makes this work: we never hold the full JSON in memory at once. io.Pipe creates a pipeline where encoding, compression, and HTTP transmission happen concurrently:
func (c *Client) doSend(ctx context.Context, snapshot *model.ClusterSnapshot) (...) {
    pr, pw := io.Pipe()
    cw := NewCountingWriter(pw)
    zw, _ := zstd.NewWriter(cw, zstd.WithEncoderLevel(zstd.SpeedDefault))
    origCw := NewCountingWriter(zw)

    go func() {
        encodeErr := json.NewEncoder(origCw).Encode(snapshot)
        closeErr := zw.Close()
        if encodeErr != nil {
            pw.CloseWithError(fmt.Errorf("JSON encode failed: %w", encodeErr))
        } else if closeErr != nil {
            pw.CloseWithError(fmt.Errorf("zstd close failed: %w", closeErr))
        } else {
            _ = pw.Close()
        }
    }()

    req, _ := http.NewRequestWithContext(ctx, http.MethodPost, url, pr)
    req.Header.Set("Content-Encoding", "zstd")
    // ...
}
The encoder writes to a CountingWriter → zstd encoder → another CountingWriter → pipe writer. The HTTP client reads from the pipe reader. At no point does the full uncompressed JSON exist in memory as a single allocation. We track both original and compressed sizes for monitoring. A sudden drop in compression ratio might indicate unusual data patterns.
The State Machine
The main loop is governed by five states: Starting, Running, Backoff, Stopped, and Exiting. State transitions are driven by HTTP response codes:
func (sm *StateMachine) HandleHTTPStatus(statusCode int, retryAfterSeconds int) {
    switch {
    case statusCode == 200:
        sm.state = StateRunning
    case statusCode == 401 || statusCode == 403:
        sm.state = StateStopped
        sm.stateReason = "authentication failed"
    case statusCode == 402:
        sm.state = StateBackoff
        sm.stateReason = "quota exceeded"
        sm.backoffUntil = sm.clock.Now().Add(backoffDuration)
    case statusCode == 410:
        sm.state = StateExiting
        sm.stateReason = "agent deprecated"
    case statusCode == 429:
        sm.state = StateBackoff
        sm.stateReason = "rate limited"
    }
}The 410 Gone handler has already paid for itself. When we release an incompatible API version, old agents get a 410, log "agent deprecated," and shut down cleanly instead of crash-looping.
Transient failures (5xx, network timeouts) retry with exponential backoff: 1s × 2^attempt, up to 5 retries.
Memory Management
The agent runs for weeks between upgrades. OOM kills are not acceptable. If the agent gets killed, you lose cost visibility until someone notices and restarts it.
We handle this at three layers.
Layer 1: automemlimit. A blank import in main.go that reads the cgroup memory limit at startup and sets GOMEMLIMIT accordingly. This tells Go's garbage collector to start reclaiming memory more aggressively as it approaches the container limit, instead of waiting until the system OOM-killer steps in.
Layer 2: automaxprocs. Same idea for CPU. Reads the cgroup CPU quota and sets GOMAXPROCS so the Go scheduler doesn't spin up more OS threads than it has cores allocated.
Layer 3: MemoryPressureMonitor. A background goroutine that polls runtime.MemStats every 30 seconds and triggers a forced runtime.GC() when memory usage exceeds 80% of the limit:
type MemoryPressureMonitor struct {
    threshold float64       // 0.8 = 80%
    callback  func()        // runtime.GC in production
    interval  time.Duration // 30s default
    provider  MemStatsProvider
    stopOnce  sync.Once
    stopCh    chan struct{}
}

func (m *MemoryPressureMonitor) check() bool {
    limit := debug.SetMemoryLimit(-1) // read current limit without changing it
    if limit <= 0 {
        return false // GOMEMLIMIT not set
    }

    var stats runtime.MemStats
    m.provider.ReadMemStats(&stats)

    // Sys is total memory obtained from the OS.
    // HeapReleased is memory returned to the OS.
    // The difference is what we're actually holding.
    usage := stats.Sys - stats.HeapReleased
    ratio := float64(usage) / float64(limit)
    return ratio > m.threshold
}
The MemStatsProvider interface exists for testability. We can inject fake memory stats in unit tests instead of depending on actual runtime state. In production, it calls runtime.ReadMemStats directly.
The overlap with automemlimit is intentional. automemlimit makes the GC smarter about when to run, but it can't guarantee that a sudden allocation spike won't push past the limit before GC acts. The pressure monitor is the backstop — it forces a GC cycle every 30 seconds if we're above 80%, regardless of the normal GC schedule. A few milliseconds of GC pause is a cheap price for not getting OOM-killed when snapshot sizes spike unexpectedly.
Security
RBAC and the Helm Chart
The agent is deployed via our public Helm chart. The chart creates a dedicated ServiceAccount, sets default resource requests and limits (100m/128Mi requests, 1000m/1Gi limits), and auto-provisions a ClusterRole with exactly two verbs: list and watch. No get on individual resources. No create, update, delete, or exec. No access to Secrets or ConfigMaps.
We keep the chart source open so customers can audit the RBAC rules directly. It's the most common thing people review, and it should be.
At startup, optional resources go through a three-phase check:
func CheckResource(ctx context.Context, client kubernetes.Interface,
    discoveryClient discovery.DiscoveryInterface,
    group, version, resource string) (bool, error) {

    // Phase 1: API group exists?
    groupExists, _ := HasAPIGroup(discoveryClient, group)
    if !groupExists { return false, nil }

    // Phase 2: Resource exists in group?
    resourceExists, _ := hasResource(discoveryClient, group, version, resource)
    if !resourceExists { return false, nil }

    // Phase 3: RBAC allows list+watch?
    return CanListWatch(ctx, client, group, resource)
}
If any phase fails, that collector is simply not registered. No crash, no error, just graceful degradation.
Authentication and Transport
Every agent authenticates with a JWT containing a cluster_id claim. All traffic is TLS-encrypted; the agent refuses to start if the backend URL uses plain HTTP (unless explicitly overridden for local development).
The Container Image
Multi-stage build. golang:1.26-alpine with CGO disabled, gcr.io/distroless/static-debian12 for runtime. No shell, no package manager, no libc. Runs as nonroot:nonroot:
FROM golang:1.26-alpine AS builder
RUN CGO_ENABLED=0 GOOS=${TARGETOS} GOARCH=${TARGETARCH} go build \
-ldflags="-w -s -X main.Version=${VERSION}" \
-o kubeadapt-agent ./cmd/agent
FROM gcr.io/distroless/static-debian12
USER nonroot:nonroot
COPY /app/kubeadapt-agent .
ENTRYPOINT ["/kubeadapt-agent"]If an attacker compromises the container, there's no shell to drop into, no curl to exfiltrate with. The attack surface is the Go binary and nothing else.
Lessons Learned
The ReplicaSet decision was right. We debated whether to collect ReplicaSets. They're noisy, they bloat the payload, and customers don't interact with them. But without them, you can't trace Pod → Deployment for cost attribution. Collecting them for enrichment but excluding them from the final snapshot was the right call.
Informer resync period matters. SharedInformers re-list the full resource set periodically as a safety net for missed events. We default to 300 seconds. Too low hammers the API server. Too high means missed events when watch connections drop. Five minutes works for most clusters.
Partial data beats no data. One of our best early decisions was treating almost every failure as non-fatal. VPA collector fails? Log a warning, continue. Informer sync times out? Send what you have. One enricher fails? The others still run. An agent that crashes on any misconfiguration is an agent that's constantly restarting and providing no value.
Streaming compression was worth the complexity. The io.Pipe approach is more complex than marshaling to a byte slice. But on large clusters the JSON can be 10+ MB. Allocating that plus the compressed output means 15–20 MB of transient memory just for the send. With streaming, memory overhead is constant regardless of cluster size.
What's Next
On our near-term roadmap: delta compression to reduce bandwidth and custom resource definition support for operator-managed workloads.
If you're running Kubernetes and your cloud costs are higher than they should be, try Kubeadapt. The agent installs in under a minute via Helm, requires no dependencies beyond the Kubernetes API server, and starts delivering insights immediately.
Browse the Helm chart to see exactly what gets deployed.

Emre Kasgur
See Your Savings Potential
See exactly where your cluster spend goes and get actionable rightsizing recommendations in minutes.
10-minute setup · Works with EKS, GKE, AKS, and on-premise