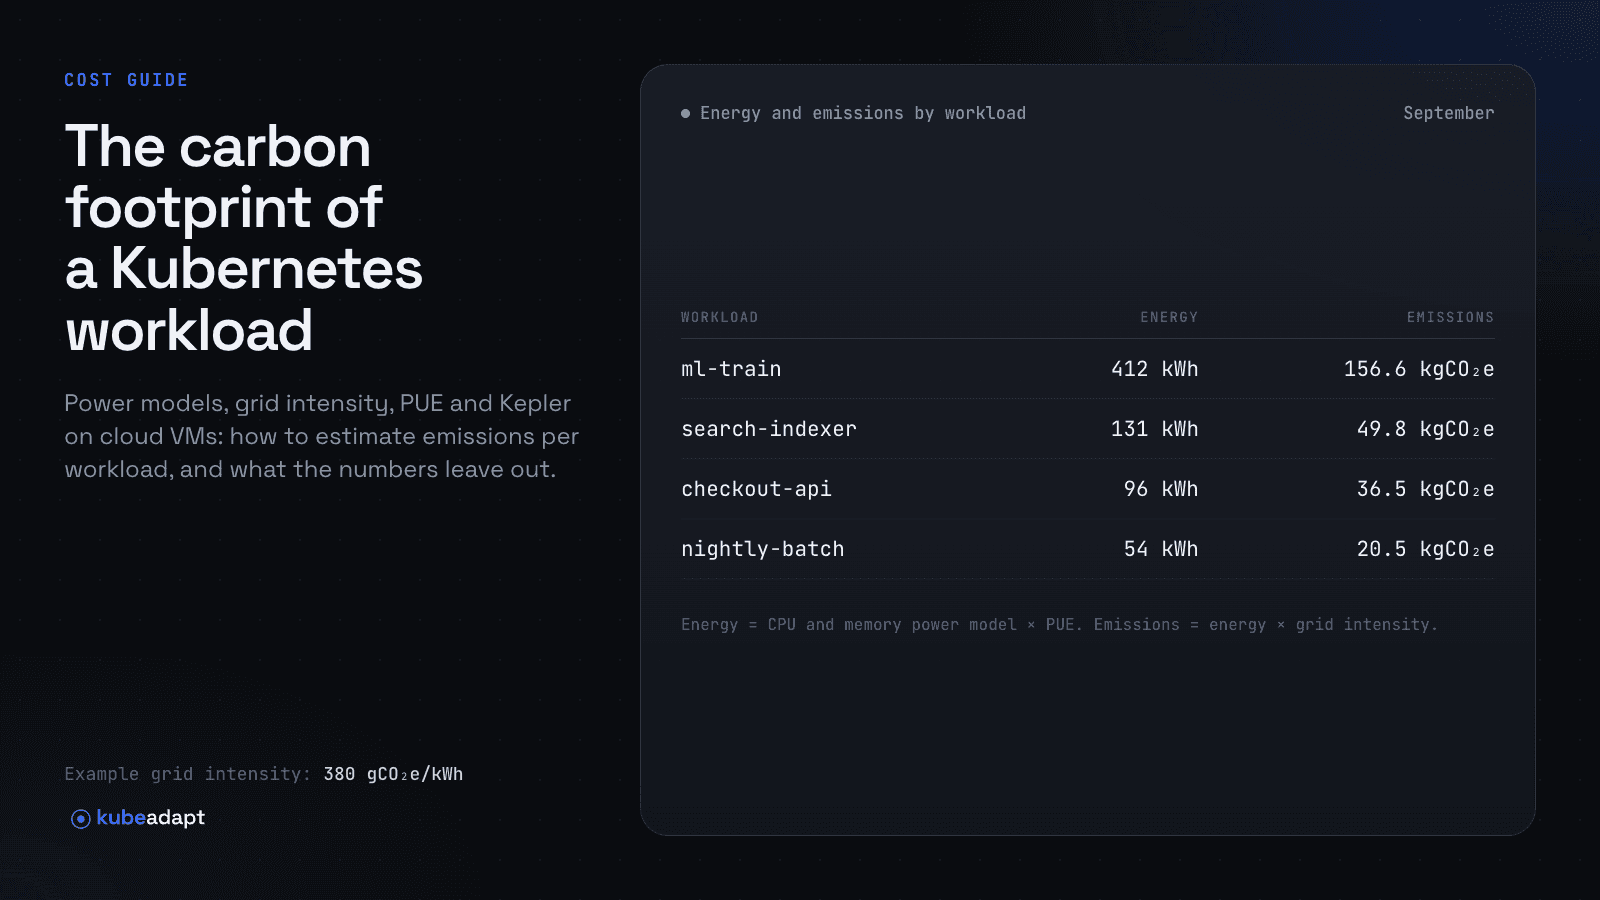
No meter sits on a pod, and the AWS sustainability console reports emissions by account, Region and service, never by pod. So a workload's carbon figure is always computed, from four inputs: the power the hardware drew, the data center's overhead, how clean the local grid is, and a share of the emissions from building the server. Name your source for each and the number holds up in a review.
This guide works one node through the method and shows which inputs move the answer most.
The formula
The Green Software Foundation's Software Carbon Intensity specification, also published as ISO/IEC 21031:2024, has two parts. Operational emissions are the energy used times the grid's carbon per kWh, and embodied emissions are a share of what it took to build the hardware. The Cloud Carbon Footprint (CCF) project turns that into numbers for cloud VMs, and OpenCost and IBM Kubecost both use its coefficients:
average watts   = min watts + CPU utilization × (max watts − min watts)
energy (kWh)    = average watts × vCPUs × hours ÷ 1000 × PUE
operational     = energy × grid intensity
embodied        = server embodied total × (hours ÷ lifespan hours) × (instance vCPUs ÷ host vCPUs)
Where you have no reading of your own, CCF supplies a default. These are its AWS values; Google Cloud and Azure have their own:
| Input | CCF default for AWS |
|---|---|
| Power per vCPU | 0.74 W idle, 3.5 W at full load, for processors it does not map |
| CPU utilization | 50% when there is no reading |
| Data center overhead (PUE) | 1.135, close to the 1.14 AWS reported for 2025 |
| Grid intensity | Per Region: EPA eGRID in the US, EEA factors in Europe |
| Embodied emissions | Per server, from the Teads dataset, spread over a 4-year life |
One node, three grids
Take one m6i.2xlarge node running for a month at half its CPU. In us-east-1 it comes to about 7 kg CO₂e. A quarter of that is its share of building the server.
The same node in three regions
One m6i.2xlarge node (8 vCPU, 32 GiB) for a month at 50% CPU. Only the grid changes; the embodied share stays the same.
Cloud Carbon Footprint method and coefficients: AWS average power curve, PUE 1.135, 730 hours, grid factors of 365 g (us-east-1), 8 g (eu-north-1) and 952 g (ap-south-1) CO₂e per kWh, and 1,400 kg CO₂e embodied per m6i host with 128 vCPUs over 4 years. Memory is left out: on AWS, CCF counts memory only above the memory per vCPU of the benchmark servers behind its power curve.
Stacked bars for one m6i.2xlarge node for a month. us-east-1: 5.13 kg operational plus 1.82 kg embodied, 6.95 kg in all. eu-north-1: 0.11 kg operational plus 1.82 kg embodied, 1.94 kg. ap-south-1: 13.38 kg operational plus 1.82 kg embodied, 15.2 kg.
On the clean grid in eu-north-1, almost all of the footprint is embodied, so a method that leaves embodied emissions out reports that region as nearly free. A pod carries its share of the node: one that uses a quarter of the CPU carries a quarter of the emissions.
Measured power, or modeled
Kepler, a CNCF Sandbox project, reads hardware power meters such as Intel RAPL and attributes the power to pods. On bare metal that is close to a measurement.
Cloud VMs, which run most managed Kubernetes, can't read those meters. Kepler's own draft proposal for VM power models says current deployments in VMs "cannot provide accurate power consumption estimates". So on EKS, AKS and GKE both approaches are models, and the CCF one needs only instance type, utilization and region.
Which grid number to use
Grid intensity moves the result more than any other input. Annual averages are the usual baseline, and Ember puts the 2025 US average at 384 g CO₂e per kWh. For work you can move in time, Electricity Maps publishes intensity down to 5-minute resolution. Say whether your factor is lifecycle, which includes fuel extraction and building the plants, or direct, which counts only what is burned.
Use location-based figures, from the grid where the power was used, for engineering decisions such as where a batch job runs. Market-based figures subtract renewable energy certificates and power purchase agreements, so they describe contracts more than the power a node drew. The GHG Protocol asks for both in corporate reports, and the SCI specification allows neither certificates nor offsets.
What lowers the number
The levers that cut cost cut emissions too, with one twist: a node's embodied share is spent whether it is busy or idle.
- For work that can move, region comes first. The figure above shows how far apart the grids are.
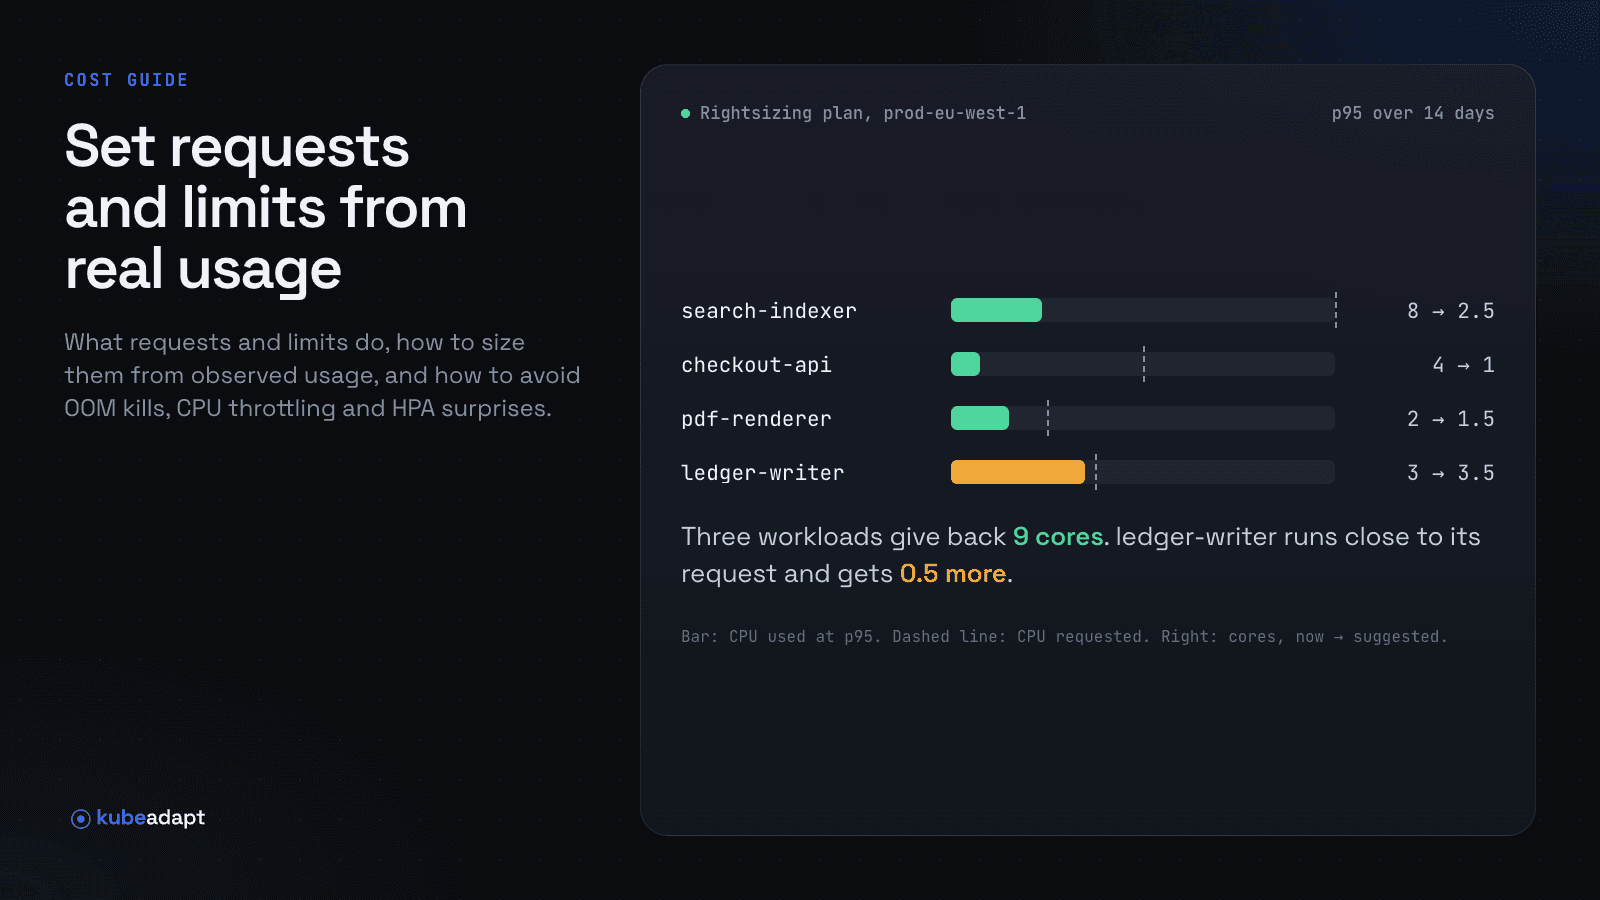
- Padded requests keep extra nodes running, each with its embodied share. See how to set requests and limits.
- Fewer, fuller nodes cut idle power, and newer instance generations usually do more work per watt.
- A staging cluster that runs all weekend carries its full embodied share for nothing.
Carbon per workload in Kubeadapt
Kubeadapt GreenOps reports kg CO₂e per workload, team and cluster from the inputs this guide walks through: the grid intensity of each node's region, the provider's data center overhead and the hardware's embodied emissions. Embodied emissions are in the total, so a clean region doesn't look free.
Each month GreenOps produces a carbon report as a PDF and a spreadsheet. Kubeadapt doesn't change the cluster: your team applies the rightsizing and node layout recommendations, and each node they remove comes off the next month's report. Like every per-workload figure on this page, these are estimates from published factors.
Install the agent with the quick start, and GreenOps reports kg CO₂e for every workload in the cluster.
Sources
- Cloud Carbon Footprint: Methodology
- Cloud Carbon Footprint: Embodied emissions
- Cloud Carbon Footprint: AWS instance coefficients (source)
- Green Software Foundation: Software Carbon Intensity specification
- ISO/IEC 21031:2024, Software Carbon Intensity
- CNCF: Kepler re-architected (2026-06-30)
- Kepler on GitHub
- Kepler: VM CPU power model proposal (draft)
- Ember: Global Electricity Review 2026
- Electricity Maps: Methodology
- GHG Protocol: Scope 2 market-based method update (2026-10-16)
- AWS: Customer Carbon Footprint Tool release notes
- AWS: Sustainability
- Google: Data center efficiency
- OpenCost: Carbon costs
- Kubecost docs: Carbon costs