A cloud bill prices machines. Kubernetes runs dozens of workloads on each machine, moves them around every day and shares the rest of the cluster between them. So the bill can tell you that a node group cost $9,000 last month, but not which service, namespace or team spent it. Kubernetes cost monitoring closes that gap: it divides what the cluster costs among the things running on it, continuously, so each owner can see their share.
This guide explains how those numbers are built, which views are worth having and what to check before you trust any tool's figures, including ours.
Where the numbers come from
Every Kubernetes cost tool, whatever it calls itself, does the same three things.
- Price the infrastructure. Each node gets an hourly price from its instance type, region and purchase option (on-demand, spot, reserved). Add the other costs the cluster depends on: persistent volumes, load balancers and, on managed Kubernetes, the control plane fee ($0.10 per hour per cluster on EKS standard support).
- Measure what each workload takes. For every container, record its CPU and memory requests (what the scheduler reserved for it) and its actual usage, at a fine enough interval to catch short jobs and spikes.
- Allocate. Divide each node's price among the containers on it, using requests, usage or a mix of the two. Then decide what to do with what's left over: the idle capacity nobody requested and the shared costs nobody owns directly.
Step three is where tools differ most, and it's the one you should understand before you put a number in front of a team. Our guide to Kubernetes cost allocation covers it in detail.
Requests, usage, or both
The scheduler places pods by their requests, so requested capacity is unavailable to anyone else whether it's used or not. Charging by requests reflects that. But it hides waste: a workload that requests 4 cores and uses 0.3 looks the same as one that uses all four.
Charging by usage shows waste but rewards over-requesting: the over-provisioned workload pays only for what it touches, and the cost of the capacity it blocks lands on someone else.
The common answer, used by the OpenCost specification and by Kubeadapt, is to charge each container for the greater of its request and its usage, minute by minute. Nobody can block capacity for free, and nobody escapes the cost of a spike above their request.
Views worth having
A useful setup answers these questions without anyone writing a query:
- What did each team and namespace cost last month? This is the view finance and engineering leads ask for, and it needs reliable ownership (labels or an assignment of namespaces to teams).
- Which workloads cost the most, and what changed? Sort by cost, compare two periods, and see the top movers. Most cost reviews start and end here.
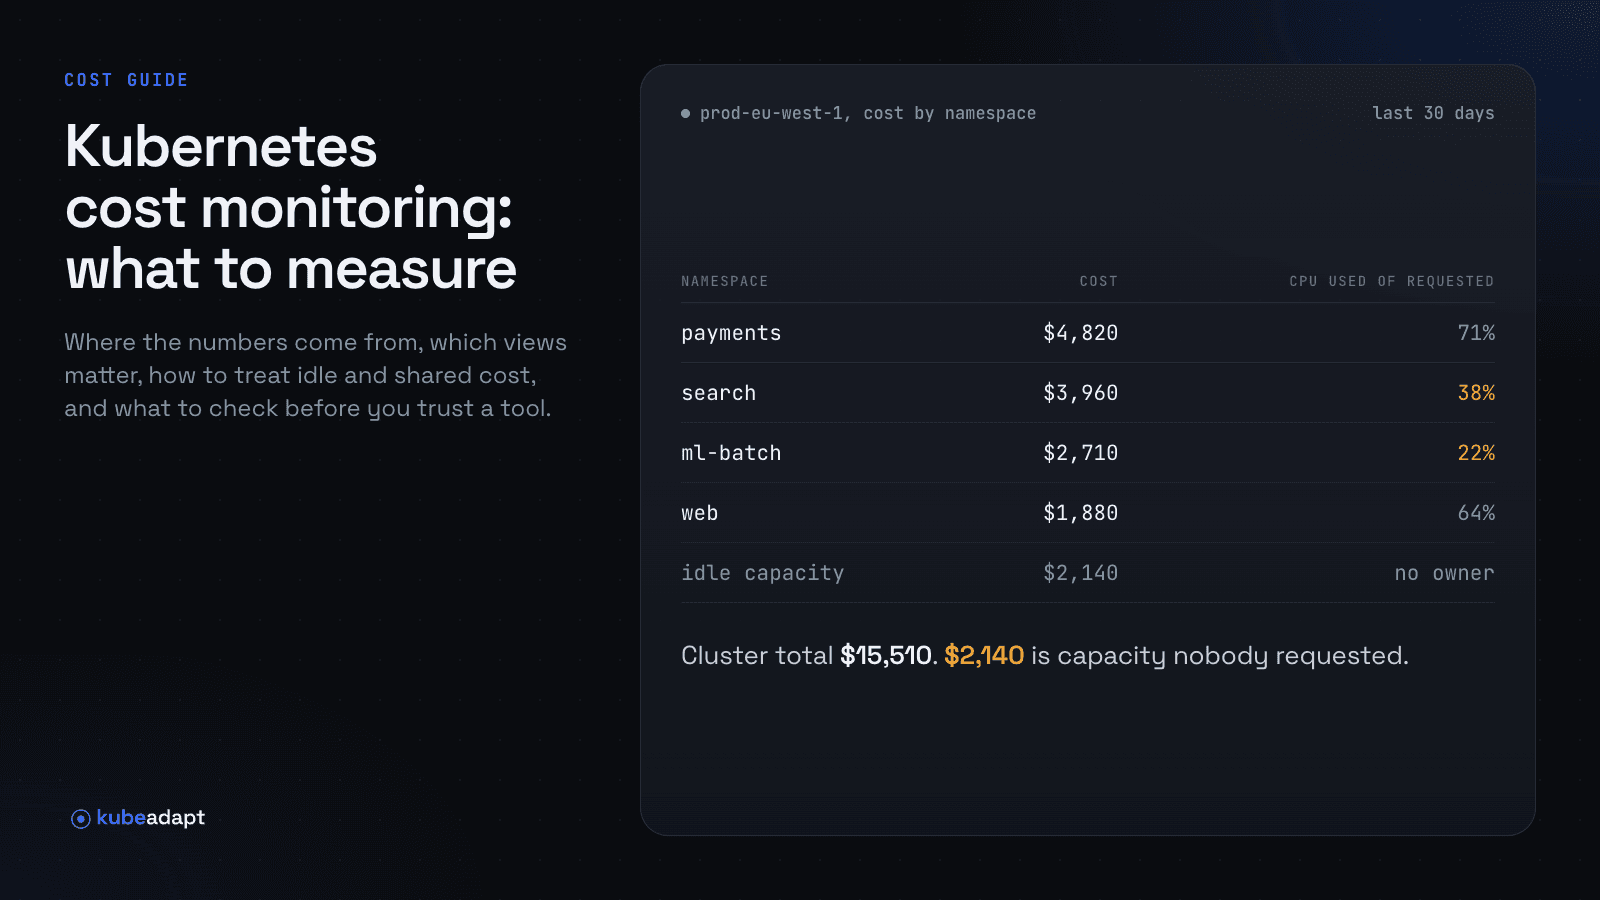
- How much of the bill is idle? The capacity no workload requested is a cluster-level decision (node sizes, autoscaler settings, bin-packing), not any one team's fault. Show it as its own number.
- Where is the gap between requests and usage? A workload with a large, steady gap is a rightsizing candidate. See how to set CPU and memory requests.
- What will this month cost? A projection from the month so far catches surprises while there's still time to act.
Grouping matters as much as the numbers. Cost by cluster and namespace is the minimum. Cost by workload (Deployment, StatefulSet, Job), by node and node group, by label and by team is where decisions get made.
Mistakes that make the numbers wrong
- Missing costs. Node prices alone undercount. Persistent volumes, load balancers, the control plane fee and data transfer all belong to the cluster. Data transfer is the hardest, because the bill never attributes it to a pod. If a tool leaves a cost out, it should say so.
- List prices on discounted capacity. If you run on Savings Plans, reserved instances or committed-use discounts, list prices overstate cost. Check whether the tool reads your actual rates or applies public prices.
- Idle cost hidden or spread silently. Both are legitimate choices: idle can be its own line, or spread across workloads in proportion to their use. What matters is that the reader can tell which one they're looking at.
- Short-lived pods missed. Batch jobs that run for two minutes still cost money. Sampling once an hour misses them.
- Treating estimates as measurements. A figure built from list prices and minute-level samples is an estimate of the bill, not the bill. A good tool labels which numbers are measured, which are estimated and which are incomplete.
Checking a tool's numbers
Before you rely on any cost tool, do three checks:
- Total it. Add up the cluster's cost for a full month and compare it with the matching lines on your cloud bill (EC2 instances for the node group, EBS, ELB, EKS). Expect differences from discounts, data transfer and anything the tool doesn't price. Make sure you can explain them.
- Spot-check a workload. Pick one Deployment, take its requests and usage, and do the arithmetic by hand with your node price.
- Follow a change. Scale a workload up for a day and confirm the cost moves where you expect.
Exporting the data
Cost data is more useful when it can leave the tool. Look for CSV exports for one-off analysis, an API for automation, and support for FOCUS, the FinOps Foundation's open format for cost data, so Kubernetes costs can sit next to the rest of your cloud spend. See FOCUS for Kubernetes cost data.
How Kubeadapt does it
Kubeadapt runs a small agent in each cluster, installed with one Helm command. Every 60 seconds it reads requests, limits, usage and capacity, and sends them to Kubeadapt, which prices them. What it does:
- Pricing. Charges each container for the greater of request and usage. Prices nodes from public on-demand and spot rates for AWS, Google Cloud and Azure. Can read AWS Savings Plans and reserved instances from a connected AWS account. Takes your own rates for on-premises clusters.
- Idle and shared cost. Shows idle capacity and shared costs (system pods, the control plane fee, load balancers, persistent volumes). You choose between seeing them distributed (Fully Loaded) or seeing workloads alone (Workload Only).
- Views. Cost by cluster, namespace, workload, node, pod and container in Cost Explorer, and by team and label in Cost Attribution. Daily, weekly and monthly reports.
- Exports. CSV, an API and a FOCUS export.
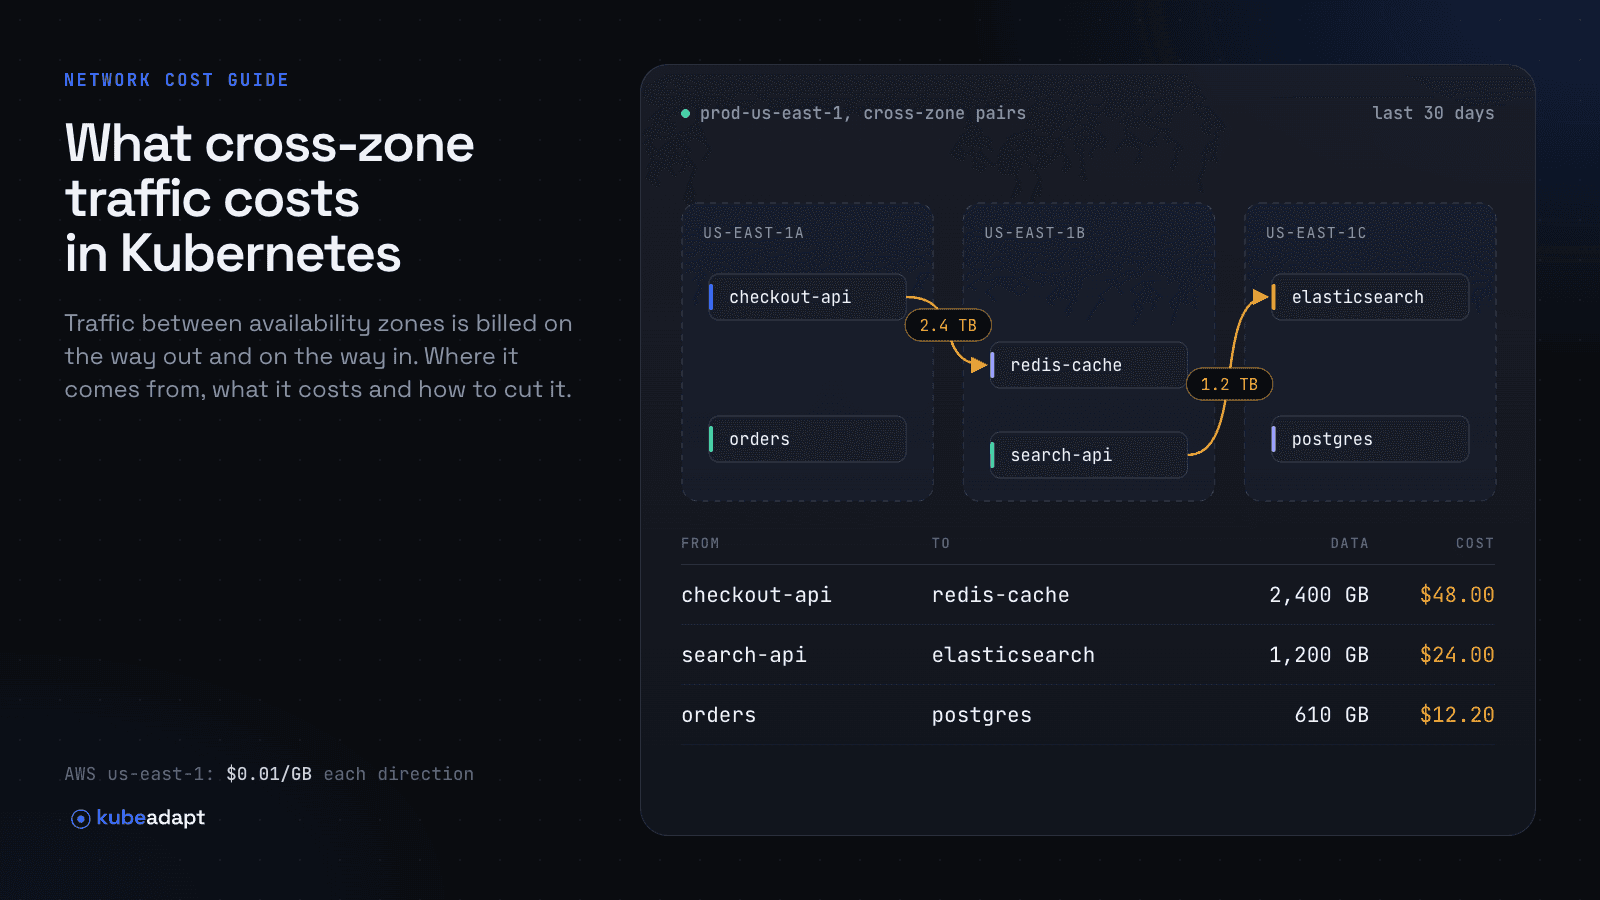
It is not a billing system and doesn't read your cloud invoice. Its figures are computed from usage and prices, and how costs are computed documents every step. Network cost per workload (cross-zone, NAT gateway and internet egress) comes from an optional eBPF agent.
See Cost monitoring for a tour, or get started in about five minutes.