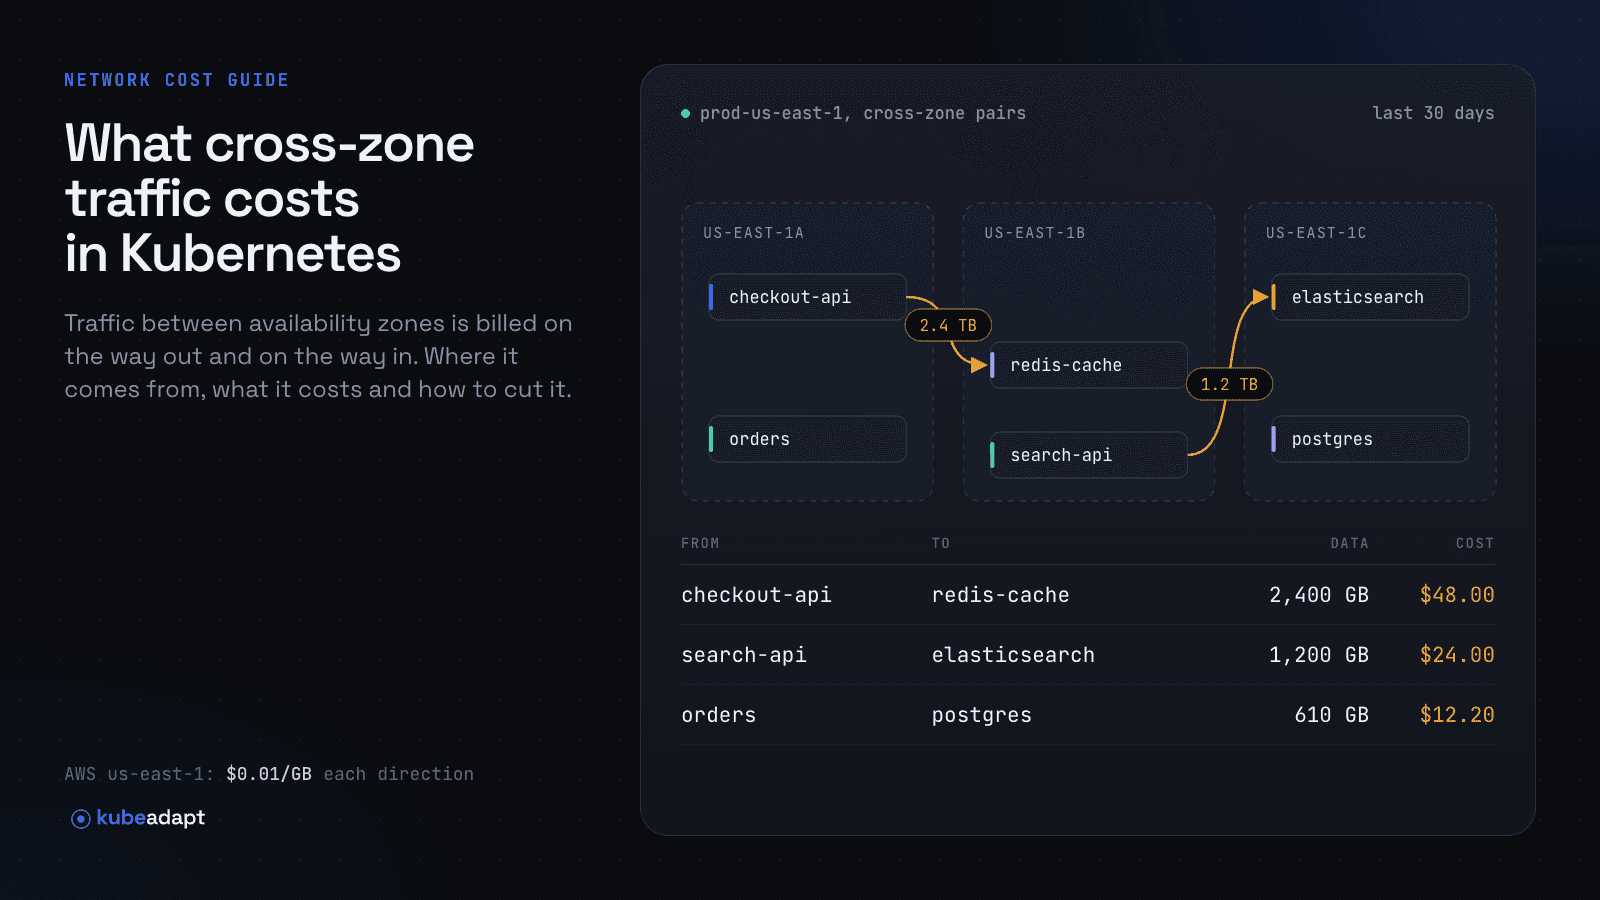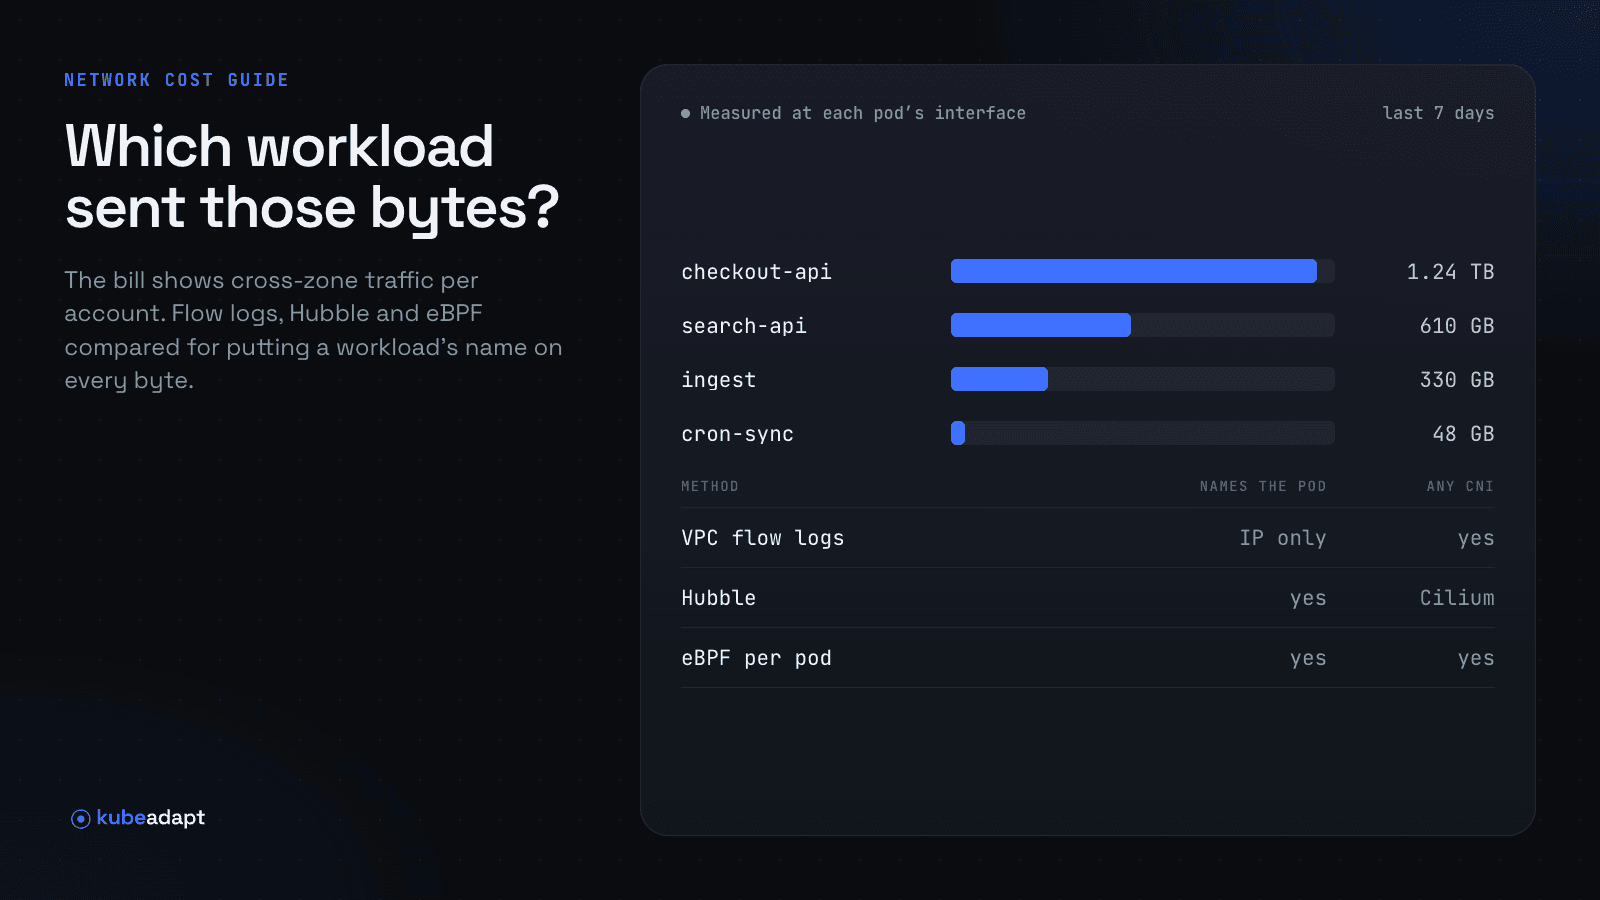
The cloud bill charges cross-zone traffic to nodes, and one node runs pods from many teams. To put that cost on workloads you need bytes for each pair of pods, and where a tool watches the packet decides whether it can give you that. This guide compares the common methods and the mistakes that double your numbers. Prices are in Kubernetes cross-AZ data transfer cost.
Where each method sees the packet
A per-workload number needs four things the bill lacks: bytes per flow counted once, the original pod addresses, which pod held each address at the time (pod IPs get reused within minutes), and the zone of each end. Whether a method has them depends on where it watches.
A packet leaves a pod through the pod's own interface, one end of a virtual cable (a veth pair) whose other end sits on the node. Then it passes the node's network stack, where kube-proxy swaps a Service address for a pod address, the CNI may swap the pod's source address for the node's, and the kernel's connection tracker (conntrack) records both versions. Last, it leaves through the node's cloud network interface, where flow logs see it and the bill counts it. The earlier a method sees the packet, the more it knows about the pod.
Where each method sees a packet
A packet's path from a pod to the cloud bill. Each method watches one point, and what it can name follows from that point.
Diagram of a packet's path from the pod interface through the node network stack and the node's cloud interface to the cloud bill. eBPF at the pod and Cilium Hubble watch the pod interface and name both pods, but only eBPF counts bytes; conntrack collectors and EKS Container Network Observability work in the node's stack and need an IP join or keep only the largest flows. VPC Flow Logs see every flow after some pod addresses were rewritten to the node's, and the Cost and Usage Report has exact billed bytes but stops at the node.
Cloud flow logs plus a join
On AWS, VPC Flow Logs record bytes per connection per network interface. A custom format adds the original pod addresses and the zone of the next hop, so a record shows both zones without a node lookup. This turns on a flow log for the whole VPC, written to S3 as Parquet:
1aws ec2 create-flow-logs \
2  --resource-type VPC \
3  --resource-ids vpc-0123456789abcdef0 \
4  --traffic-type ALL \
5  --max-aggregation-interval 60 \
6  --log-destination-type s3 \
7  --log-destination arn:aws:s3:::example-flow-logs/eks/ \
8  --destination-options FileFormat=parquet,HiveCompatiblePartitions=true,PerHourPartition=true \
9  --log-format '${version} ${interface-id} ${instance-id} ${srcaddr} ${dstaddr} ${pkt-srcaddr} ${pkt-dstaddr} ${srcport} ${dstport} ${protocol} ${bytes} ${start} ${end} ${az-id} ${next-hop-az-id} ${flow-direction} ${interface-type}'
Then build the pod side. A snapshot is enough to test the idea:
kubectl get pods -A -o jsonpath='{range .items[*]}{.status.podIP}{"\t"}{.metadata.namespace}{"\t"}{.metadata.ownerReferences[0].kind}/{.metadata.ownerReferences[0].name}{"\t"}{.spec.nodeName}{"\n"}{end}'
kubectl get nodes -L topology.kubernetes.io/zone
aws ec2 describe-availability-zones --query 'AvailabilityZones[].[ZoneName,ZoneId]' --output text
The last command matters: flow logs report zone IDs such as use1-az1, node labels report zone names such as us-east-1a, and AWS maps one to the other differently in each account. For production, keep a history of when each pod IP was first and last seen, from an API server watch, and strip the pod-template hash from ReplicaSet names to get the Deployment. This Athena query joins both ends and keeps the cross-zone records:
1SELECT s.workload AS src_workload, d.workload AS dst_workload,
2       f.az_id AS src_az, f.next_hop_az_id AS dst_az,
3       SUM(f.bytes) / 1e9 AS gb
4FROM vpc_flow_logs f
5JOIN pod_ip_history s
6  ON f.pkt_srcaddr = s.ip AND from_unixtime(f.start) BETWEEN s.first_seen AND s.last_seen
7JOIN pod_ip_history d
8  ON f.pkt_dstaddr = d.ip AND from_unixtime(f.start) BETWEEN d.first_seen AND d.last_seen
9WHERE f.flow_direction = 'egress'
10  AND f.az_id <> f.next_hop_az_id
11GROUP BY 1, 2, 3, 4
12ORDER BY gb DESC;
The flow log sits after the node has rewritten some addresses, so three kinds of traffic carry the node's address. Traffic to anything outside the VPC leaves with it, because the Amazon VPC CNI translates the pod's address by default. So do pods with hostNetwork: true. And an overlay CNI (VXLAN or Geneve) hides pod addresses inside node-to-node packets.
Flow logs delivered to S3 cost $0.25 per GB in us-east-1. AWS published a reference design along these lines in 2022 and warned that it "was neither designed to be used as a chargeback nor for any billing purposes."
On GKE, VPC Flow Logs add the pod and workload to each record, which removes most of the join, but their byte counts are estimated from sampled packets.
Cilium Hubble
Hubble reads events from Cilium's own eBPF datapath, so each flow comes with the source and destination pod, workload, Service and the DNS names behind an address. On a Cilium cluster it is the quickest way to see who talks to whom across zones, at no extra cost.
It doesn't count bytes per workload. Hubble's flow record has no byte field, and Cilium's own byte counters carry no pod labels. Host-network pods all appear as one identity, reserved:host.
Conntrack collectors
A conntrack collector is a DaemonSet on the host network that reads the node's connection table. IBM Kubecost's network costs DaemonSet works this way.
Each conntrack entry keeps the connection before and after translation, so traffic the CNI rewrote to the node's address can still be traced to the pod, which flow logs can't do. But byte counters are off by default (nf_conntrack_acct is 0), and on Cilium with eBPF host routing "packets no longer hit the netfilter tables." The table also holds addresses, not pods, so the IP join and its reuse problem remain.
eBPF at the pod's interface
The earliest point is the pod's own interface. Microsoft Retina's packetparser plugin, for example, attaches eBPF programs "to each pod's virtual interface (veth)," and in its advanced mode labels byte counts with the pod and workload at both ends.
This is the point that names the workload. The packet hasn't reached the node's stack, so its source is still the pod's own address, and the count happens while the pod is alive, so a reused IP never has to be matched afterwards. Overlay encapsulation comes later, and nothing depends on netfilter.
The price is a privileged DaemonSet on every node. Retina's docs warn that this mode "has scale limitations," because its metric cardinality grows with every pair of endpoints, and its output is Prometheus metrics in bytes, with no prices. Kubeadapt's network agent measures from this point too.
EKS Container Network Observability
On EKS, Container Network Observability runs a CloudWatch Network Flow Monitor agent on every node and sorts pod flows into categories such as Intra AZ and Inter AZ, by Deployment and pod. The agent "collects the top 500 network flows (based on volume of data transferred) every 30 seconds" on each node. It finds the biggest cross-zone flows quickly, but keeps no complete ledger and shows no prices. In us-east-1 it costs about $5 per node a month, plus metrics.
Four flows, four views
Take four flows that cross a zone in one example month, on an EKS cluster with the Amazon VPC CNI (for the Hubble column, assume Cilium runs too). Flow 3 goes through a NAT gateway in another zone. Flow 4 comes from a Job whose pod IP belonged to a checkout pod six minutes earlier.
| Example flow | Flow logs and a join | Conntrack collector | Hubble | eBPF at the pod |
|---|---|---|---|---|
1. checkout to inventory, 900 GB | Both pods, doubled if you sum both nodes' records | Both pods, after an IP join | Both pods, no bytes | Both pods, 900 GB |
2. ingress-nginx on the host network to web, 600 GB | The node | The node | reserved:host | The node's own traffic |
3. api to payments.example.com, 200 GB | The node | api | api, no bytes | api and the DNS name, 200 GB |
4. report-builder to warehouse-db, 300 GB | checkout, unless the join checks IP lifetimes | Same risk | report-builder, no bytes | report-builder, 300 GB |
With a careless join, flow logs put 2,100 GB on checkout against a true 900. At the pod, flows 1, 3 and 4 land on the right workload with their bytes. Flow 2 is the limit for every method: a host-network pod has no address or interface of its own, so it counts as the node's traffic.
From bytes to dollars, checked against the bill
Multiply each workload's cross-zone bytes, counted once, by your provider's rate. On AWS, leave out ALB-to-target traffic over private IPs and traffic through PrivateLink or Transit Gateway, which AWS doesn't bill as cross-zone transfer.
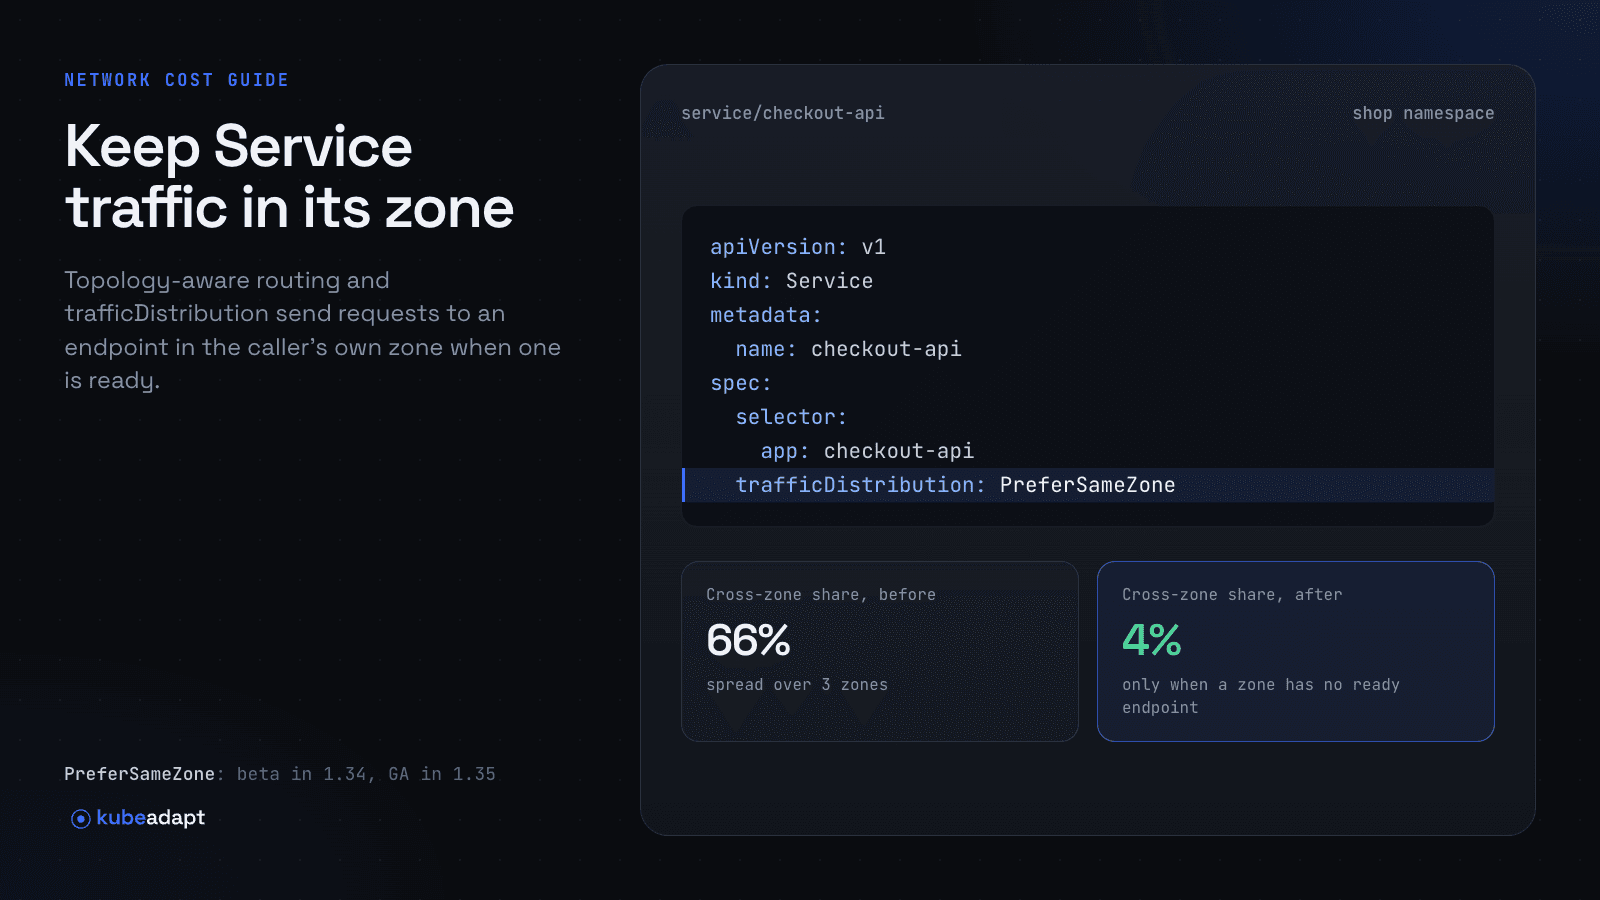
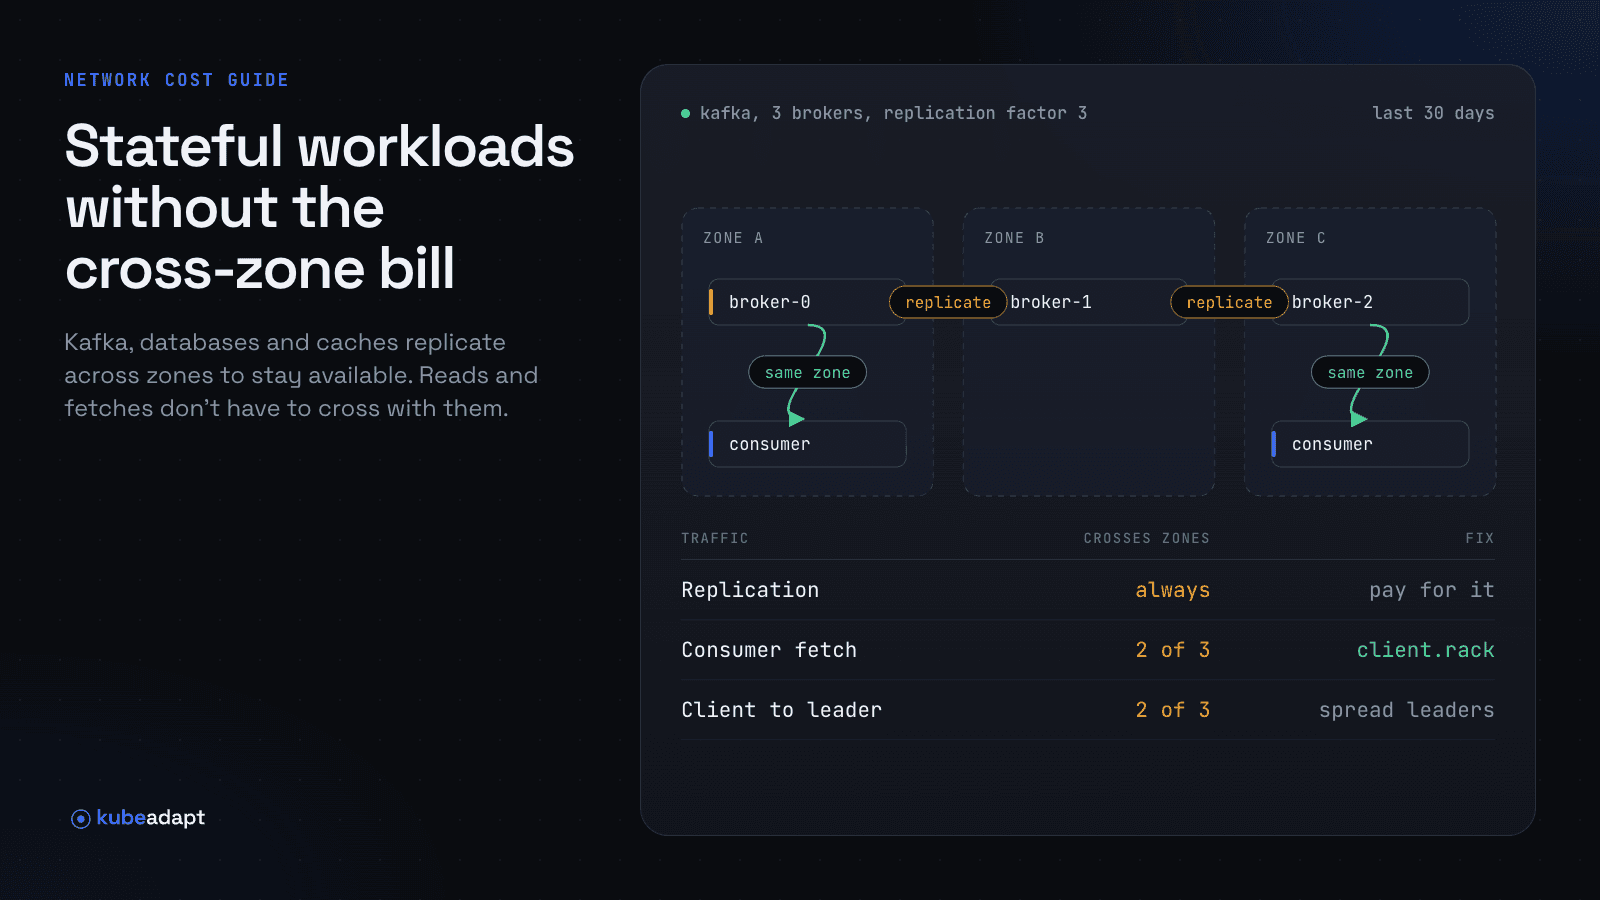
Then check the total against the bill. AWS writes an "in" and an "out" line for each transfer, so InterZone-In plus InterZone-Out should come close to twice your measured cross-zone GB. A large gap means double counting, missing host-network traffic, or managed databases outside the cluster. The fixes are in topology-aware routing, stateful workloads and cross-zone traffic, EKS NAT gateway cost and Kubernetes internet egress cost.
Doing this with Kubeadapt
Kubeadapt's optional network agent counts traffic at each pod's own network interface, so it keeps the real pod address instead of rebuilding it from conntrack or flow logs. It runs one pod per node on Linux 5.10 or newer, never records payload bodies, and names external destinations from DNS; the agent docs list its prerequisites.
Network Intelligence prices every path per workload with published AWS and Azure rates or your own rate card. Explorer lists traffic by workload pair or zone pair, most expensive first, and can draw the zone pairs as a grid.
Kubeadapt doesn't change your Services; your team makes the change. With Kubeadapt MCP in Claude Code, you can ask which workload pairs send the most across zones and have Claude Code open a pull request on the Service manifests. After the rollout, Focus on that Service shows whether its callers still reach it from other zones. With the AWS Cost and Usage Report connected, Kubeadapt reconciles workload cost with the bill, so what you charge back ties to the invoice.
Before you enable the network agent
The network agent requires a chart version later than 1.0.8. Do not enable it with chart version 1.0.8 or earlier on a cluster that enforces network policy.
Install Kubeadapt, or book a demo to see Explorer on a live cluster.
Sources
- Amazon VPC: Flow log records
- Amazon EKS: Enable outbound internet access for Pods (SNAT behavior)
- AWS blog: Getting visibility into your Amazon EKS cross-AZ pod to pod network bytes
- AWS RAM: Availability Zone IDs for your AWS resources
- Amazon EKS: Monitor Kubernetes workload traffic with Container Network Observability
- Amazon CloudWatch pricing (vended logs, Network Monitoring)
- AWS Price List API: AmazonCloudWatch offer file (us-east-1)
- Amazon EC2 On-Demand Pricing: Data Transfer within the same AWS Region
- AWS Data Exports: Understanding data transfer charges
- Google Cloud: VPC Flow Logs
- Google Cloud: About VPC Flow Logs records
- Google Cloud: All networking pricing
- Cilium: Monitoring and metrics (Hubble metrics)
- Cilium: Hubble flow API (flow.proto)
- Cilium: Terminology (reserved identities)
- Cilium: Tuning guide (eBPF host routing)
- Linux kernel: Netfilter conntrack sysfs variables (nf_conntrack_acct)
- IBM Kubecost: Network cost configuration
- Microsoft Retina: Advanced metrics
- Microsoft Retina: Metric modes
- Microsoft Retina: packetparser plugin